Figure 2.

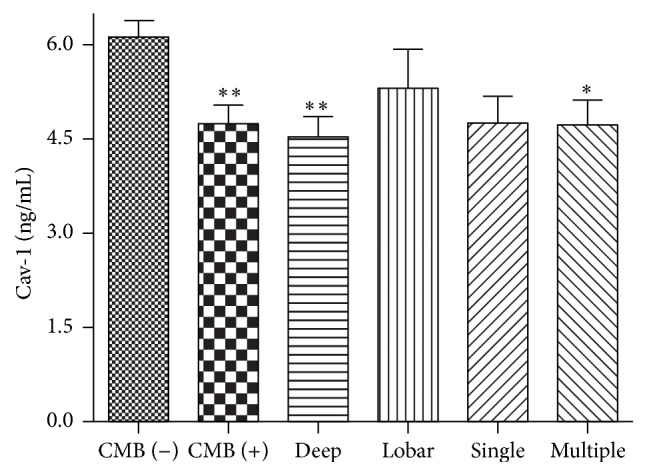
Mean ± SEM of Cav-1 levels are shown according to the presence, location, and number of CMBs. ∗ P < 0.05; ∗∗ P < 0.01 compared with CMBs (−) group. CMBs indicate cerebral microbleeds. Cav-1 indicates caveolin-1.

Mean ± SEM of Cav-1 levels are shown according to the presence, location, and number of CMBs. ∗ P < 0.05; ∗∗ P < 0.01 compared with CMBs (−) group. CMBs indicate cerebral microbleeds. Cav-1 indicates caveolin-1.