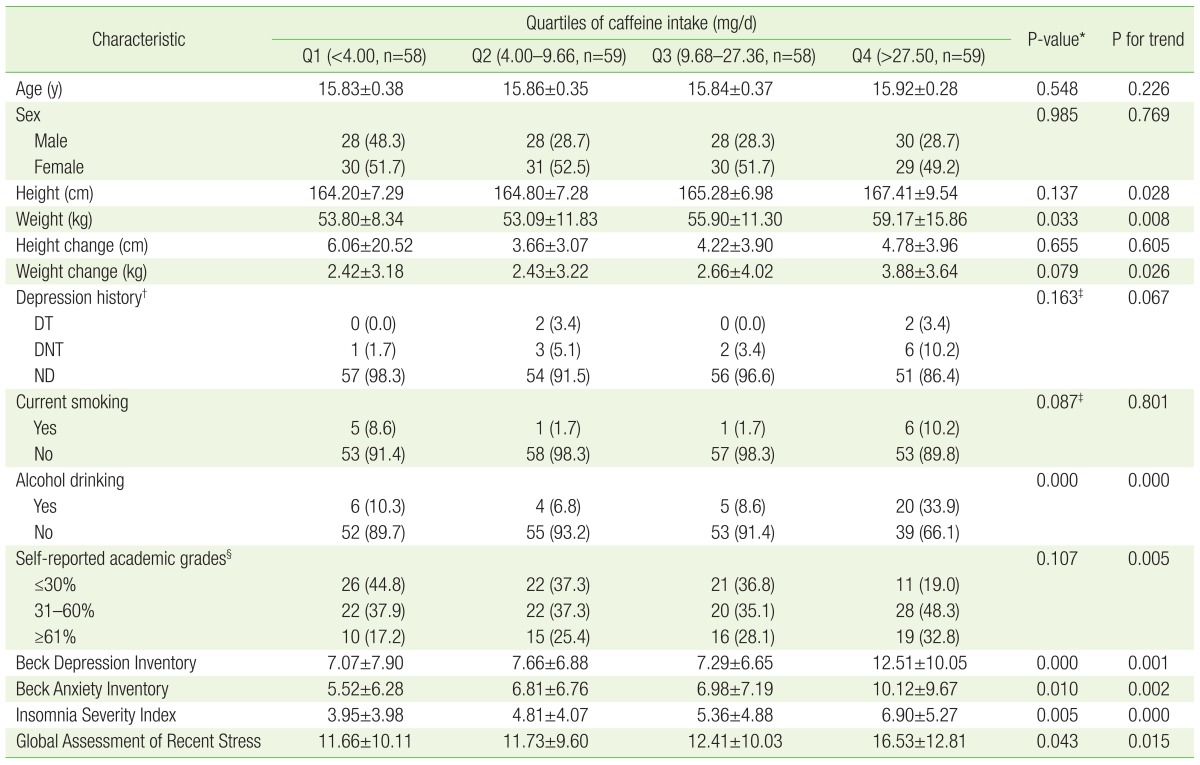
Table 2. Characteristics of the subjects according to caffeine intake groups.
Values are presented as mean±standard deviation or number (%).
*Analysis of variance or Pearson's chi-square test. †DT: diagnosed and treated, DNT: diagnosed and not treated, ND: not diagnosed. ‡Fisher's exact test. §Two non-responses were excluded (n=232).

