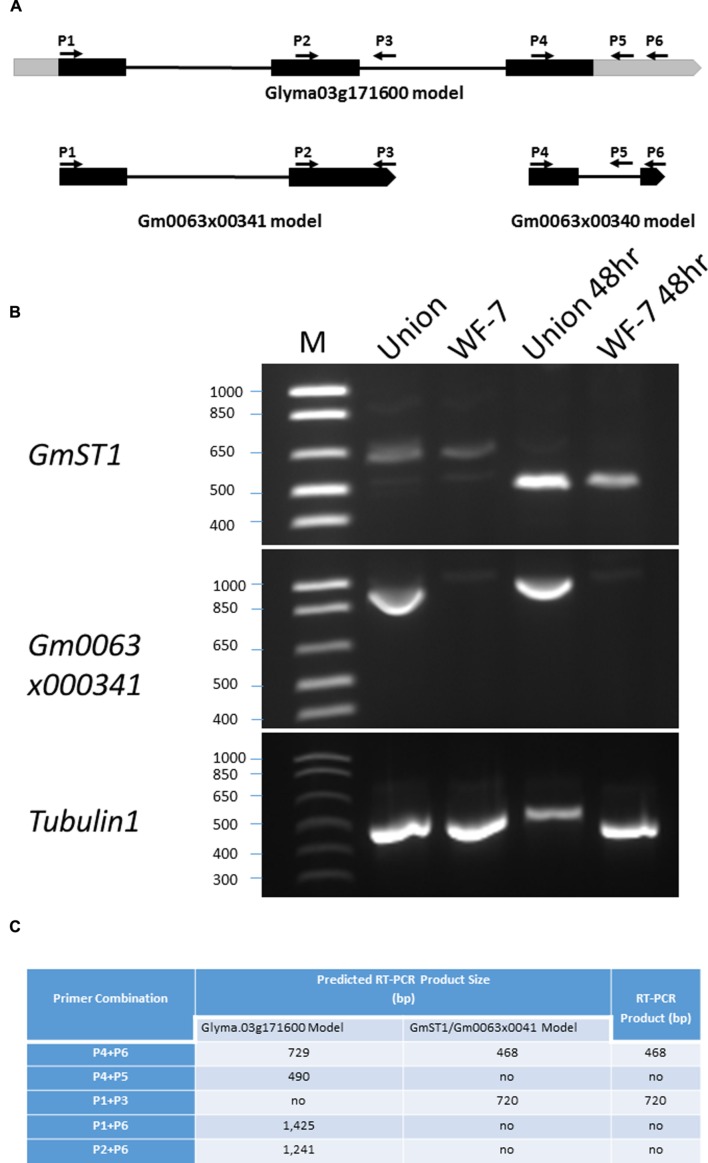
FIGURE 7.
Characterization of gene structure around GmST1 genomic region. (A) Schematic summary of different gene prediction models around GmST1 genomic region. Black bars represent exons, gray bars are untranslated regions (5′-UTR and 3′-UTR), and lines represent introns in their expected gene models. Primer positions (P1 through P6) are indicated in response to different gene prediction models. (B) GmST1 and Gm0063×00341 expression pattern analysis in soybean leaf tissues. RT-PCR was conducted using primer pairs corresponding to GmST1 and Gm0063×00341, respectively. Total RNA was isolated from the salt treated and untreated leaves of soybean varieties WF-7 and Union. (C) Prediction and experimental RT-PCR products around GmST1 genomic region.

