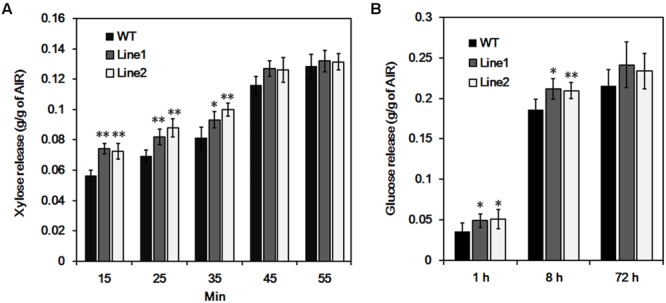
FIGURE 6.

Hydrolysis analysis of wood tissue. (A) Xylose release from wood in the process of acid pretreatment. (B) Glucose release by cellulase hydrolysis after pretreatment. Each transgenic line was multiplied through cutting propagation for analysis of biological repeats. WT, wild type plants; Line 1, Line 2, anti-PtrDUF579-3 transgenic lines. The values are mean ± SE. n = 5. Significance was determined by Student’s t-test of values of wild type and PtrDUF579-3 suppressed plants. ∗∗P < 0.01; ∗P < 0.05.
