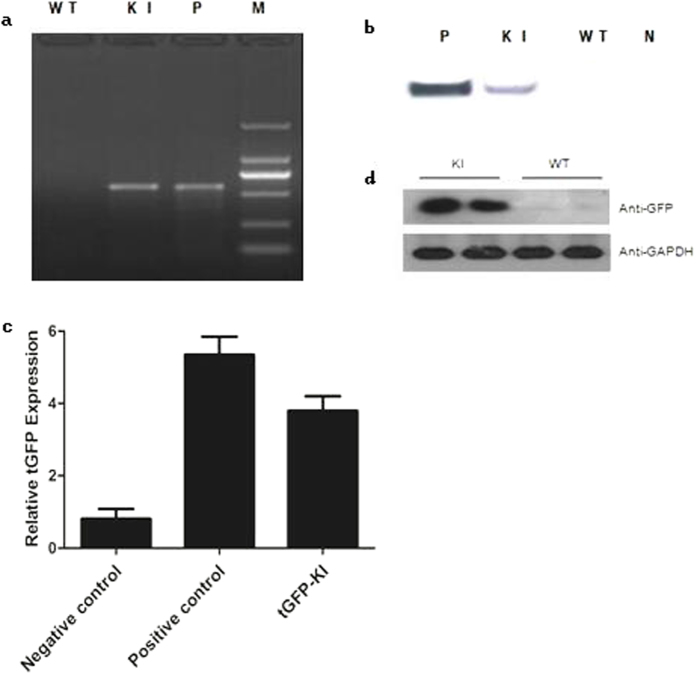
Figure 4.
(a) PCR analysis of tGFP in tissues knock-in lambs. M = marker, N = negative control, P = postive control The size of target band is about 650 bp. (b) Southern blot analysis of tGFP–KI mutant sheep, Both the negative control and tGFP-KI sheep can be detected the target sequence. (c) RT- PCR analysis of tGFP expression in tissues knock-in lambs. All the lambs were 1 month old. tGFP gene expression quantity is 4.5 times that of the negative control. (d) Western blot analysis of tGFP–KI mutant sheep. Total protein from tGFP-KI sheep was subjected to SDS-PAGE on a 12% acrylamide gel. GADPH was used as a loading control. The tGFP gene expression cann’t be detected in controls.

