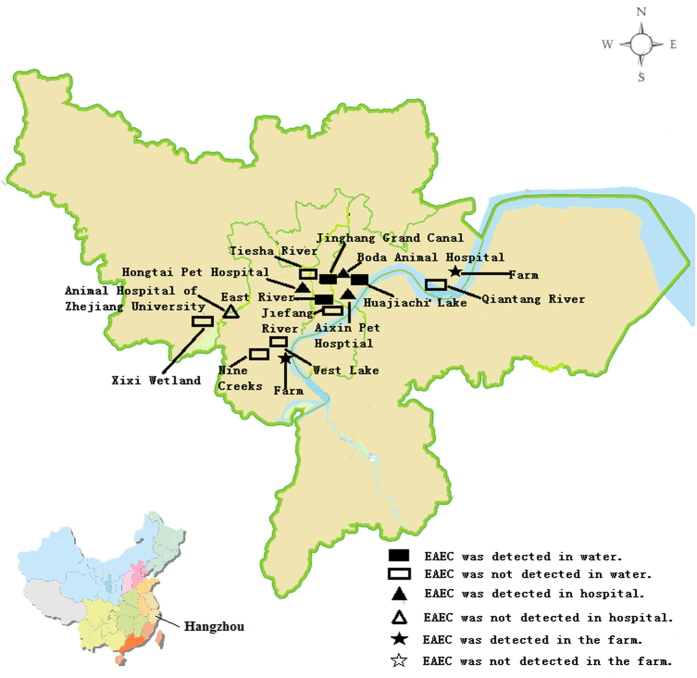
Figure 1. Distribution of sampling locations and sites where EAEC were recovered in Hangzhou, China.
The figure was generated by obtaining the map of Hanzhou city from Zhejiang Administration of Surveying Mapping and Geoinformation (ZheS(2010)280) with the agency’s permission and further refined by Adobe Photoshop CS2 software.

