Fig. 5.
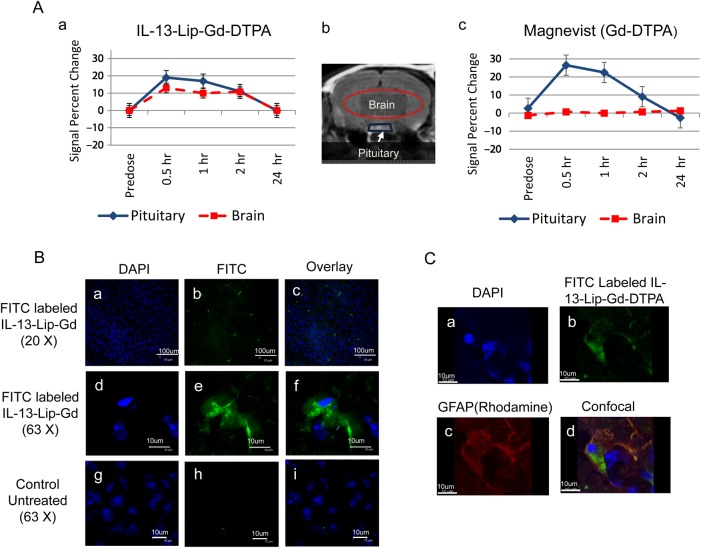
(A) The plots of an average signal intensity time-course measured in T1-weighted images post injections of IL-13-Lip-Gd-DTPA (A-a) or Magnevist (A-c) into the brain parenchyma and pituitary gland shown in the brain image (A-b) in normal animals (n = 6). The image intensity plot in blue ♦ in the location of pituitary (indicated in blue trapezoid in the brain image in b) followed the same trend for both IL-13-Lip-Gd-DTPA and Magnevist, indicating that the injections of IL-13-Lip-Gd-DTPA and Magnevist were successful. The signal in the brain parenchyma ▪ (indicated by the red-oval region in the brain image) after injection of Magnevist stays the same, while after injection of IL-13-Lip-Gd-DTPA the signal increases to about 15%. The increase in signal intensity in the brain tissue indicated that the MRI contrast agent crossed an intact blood-brain barrier (BBB) with liposomes. (B) Confocal microscopy images of brain slides. The blue color in the left column indicated the nucleus stained with DAPI (B-a, B-d, B-g), and the green color of FITC sparsely distributed in the middle column (B-b, B-e) showed the existence of IL-13-Lip in the brain tissue, confirming the penetration of the intact BBB of normal mice. The overlay for the 2 images in the right column (B-c, B-f) indicated that the retained liposomes were intracellular. No FITC was observable in the images of untreated mice (B-h, B-i). (C) Confocal microscopy images. (C-a) DAPI, (C-b) IL-13-Lip(FITC)-Gd-DTPA; (C-c) Rhodamine-labeled astrocytes marker GFAP; (C-d), co-localization of IL-13-Lip(FITC)-Gd-DTPA with GFAP in a normal brain tissue section.

