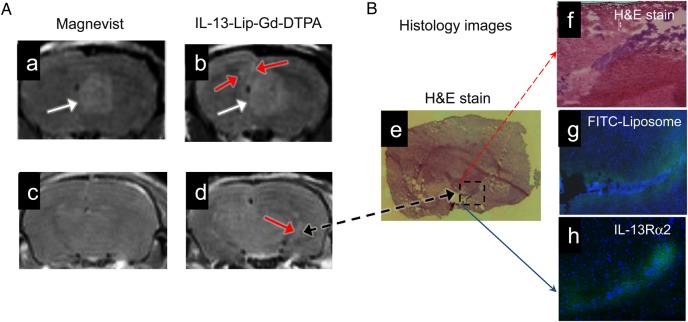
Fig. 6.
(A) T1-weighted MRI of glioma enhanced with Magnevist (a, c) and IL-13-Lip-Gd-DTPA (b, d) from the same animal. The images of the same brain slice (a, b) show the primary tumor (white arrows). Additionally enhanced focal areas (red arrows) peripheral to the primary site are shown only with IL-13-Lip-Gd-DTPA. The images (c, d) were acquired from a brain slice 2 mm posterior to the primary site and show additional tumor masses (red arrow) only with liposomes. (B) Image (B-e) of histology slice within the same brain slice in MR image in A-d. Image (B-f) is zoomed into an infiltrating brain tumor (blue color) in the dashed line box in the hematoxylin and eosin (H&E) stain. The corresponding microscopy image (B-g) shows FITC-labeled liposomes (green color) focal in the tumor area. Image (B-h) shows a confocal image of immunohistochemistry overlaid with DAPI obtained from a brain slide 300 μm from the H&E image (B-e). The differential expression of IL-13Rα2 in the glioma and adjacent normal tissues is clearly demonstrated.

