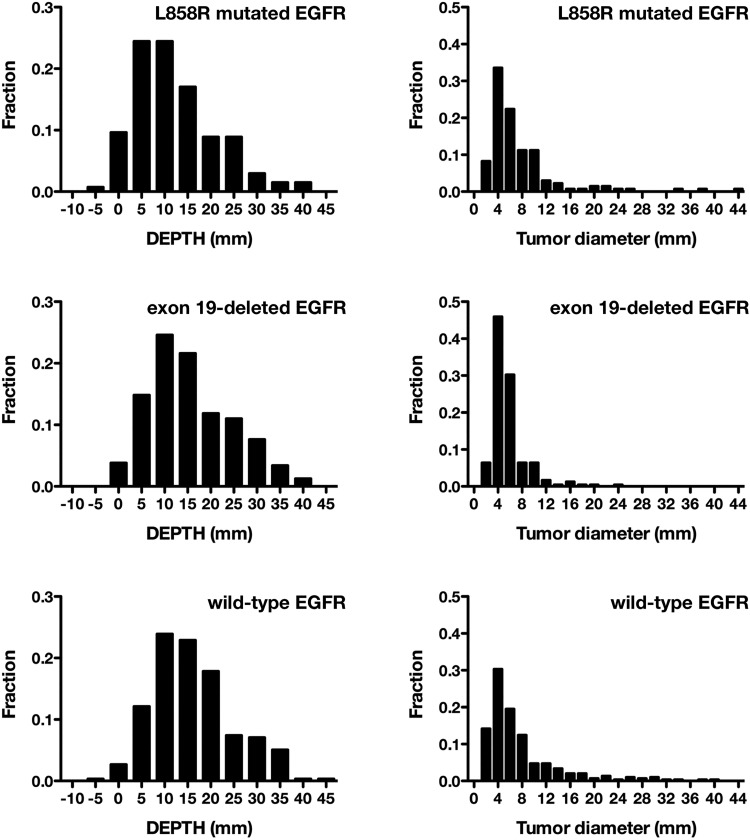
Fig. 4.
Histogram of the distance of brain metastases from the surface of the brain (DEPTH) and the maximal diameters of brain metastases after image transformation. The histogram compares adenocarcinoma patients grouped by EGFR mutation status. The lesions with L858R mutated EGFR are located significantly closer to the brain surface than the lesions with exon 19 deleted or wild-type EGFR (P = .0032 and P < .0001, respectively). As to the diameters of brain metastases after image transformation, there is a borderline difference by EGFR mutation status (P = .086).

