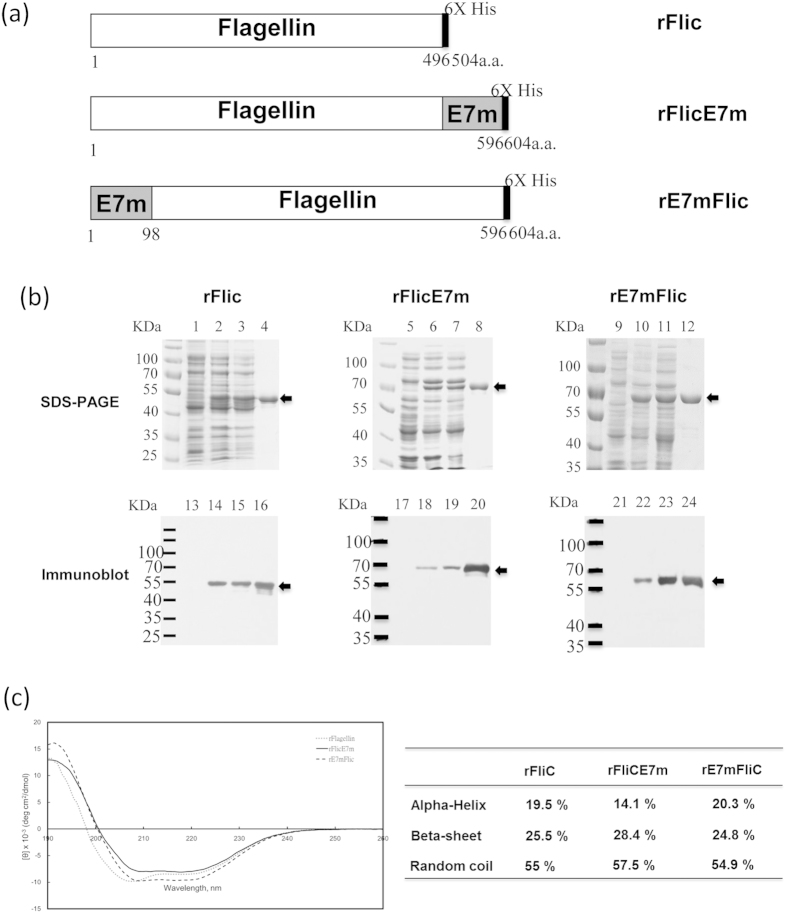
Figure 1. Construction and purification of recombinant proteins.
(a) The primary structure of the rFliC, rFliCE7m and rE7mFliC proteins are schematically shown; the proteins were expressed in E. coli BL21(DE3) star, BL21(DE3) and BL21(DE3), respectively. (b) Purification of the rFliC, rFliCE7m and rE7mFliC proteins using 10%, 8% and 8% reducing SDS-PAGE, respectively, followed by Coomassie Blue staining and immunoblotting with anti-His antibodies. Lanes 1–4 show the rFliC purification process; lanes 5–8 show the rFliCE7m purification process; and lanes 9–12 show the rE7mFliC purification process. Lanes 1, 5, and 9: protein expression in the absence of IPTG induction. Lanes 2, 6, and 10: protein expression after IPTG induction. Lanes 3, 7, and 11: cellular extract fractions. Lanes 4, 8, and 12: purified recombinant proteins. Lanes 13–24 show immunoblotting for the purification process; the samples in these lanes are identical to those in lanes 1–12. (c) Circular dichroism spectra of rFliC, rFliCE7m and rE7mFliC from 260 to 190 nm were recorded with a 0.1-cm path length quartz cell (left figure). All of the data are reported as the mean residue ellipticity [θ]. The CD spectra were analyzed by the K2D3 program, and the calculated values of the α-helix, β-sheet and random coil are shown on the right.

