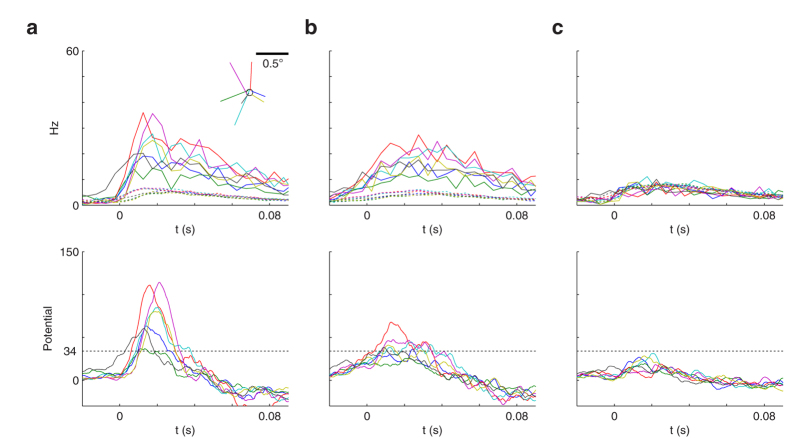
Figure 6. Rapid synchrony-based template matching.
Here we focus on the second (green) downstream neuron of Fig. 3, which prefers MSs landing in the central zone of the face image (Fig. 4b). For illustration purposes, we used again the face stimulus, and examined the responses for 7 randomly selected MSs, landing near the center (see Methods for details) (a) The top plot shows the PSTH for the selected RGCs (solid lines), and for the remaining ones (dotted lines), for each MS. t = 0 is the MS landing time. Notice that the selected RGCs tend to start firing much earlier than the others, and somewhat synchronously (they also fire more spikes). The inset shows the MS trajectories, which land in a neighborhood of the central position (circle). The bottom plot shows the downstream neuron’s unconstrained potential (ignoring the threshold). Most MSs generate a high potential peak due to nearly coincident spikes from selected RGCs. (b) With a 15 ms jitter, the selected RGCs’ response onsets are more spread out, which flattens the potential peaks. (c) As in (a) but using a different stimulus (the bike image in Fig. 5a). The selected RGCs no longer fire synchronously. Resulting potential peaks are weak. The horizontal doted line on bottom plots is a hypothetical threshold of 34, which would lead to no false alarm with the bike image, and no miss with the face image, despite strong MS-to-MS variability.

