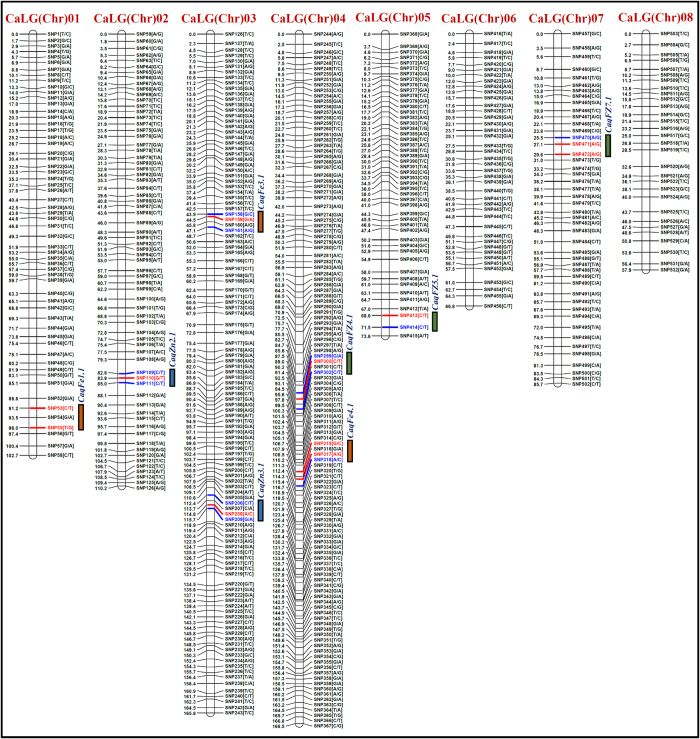
Figure 2. Eight major genomic regions harbouring eight robust QTLs (16.9–23.6% PVE) associated with seed-Fe and Zn concentrations were identified and mapped on six chromosomes (LOD > 6.0) using a 277 RIL mapping population (ICC 4958 × ICC 8261) of chickpea.
The genetic distance (cM) and identity of the marker loci integrated on the chromosomes are indicated on the left and right side of the chromosomes, respectively. The markers flanking and tightly linked to the QTLs are indicated with blue and red coloured lines, respectively. Orange, blue and green boxes indicate the QTLs governing seed-Fe, seed-Zn and both seed-Fe and Zn concentrations, respectively mapped on the chromosomes of a high-density genetic map.

