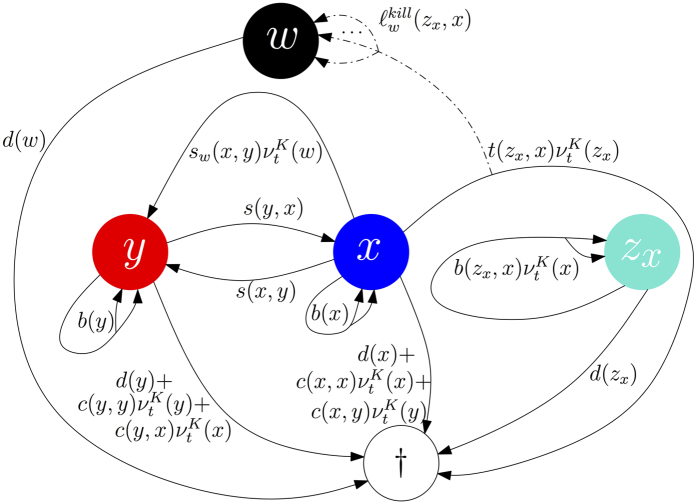
Figure 1. Dynamics of the process (without mutations) modelling the experiments described in9.
Here, x denotes differentiated melanoma cells, y dedifferentiated melanoma cells, zx T-cells and w TNF-α. At each arrow the rate for occurrence of the corresponding event is indicated (e.g. birth is illustrated with two arrowheads and death with an arrow directed to †).

