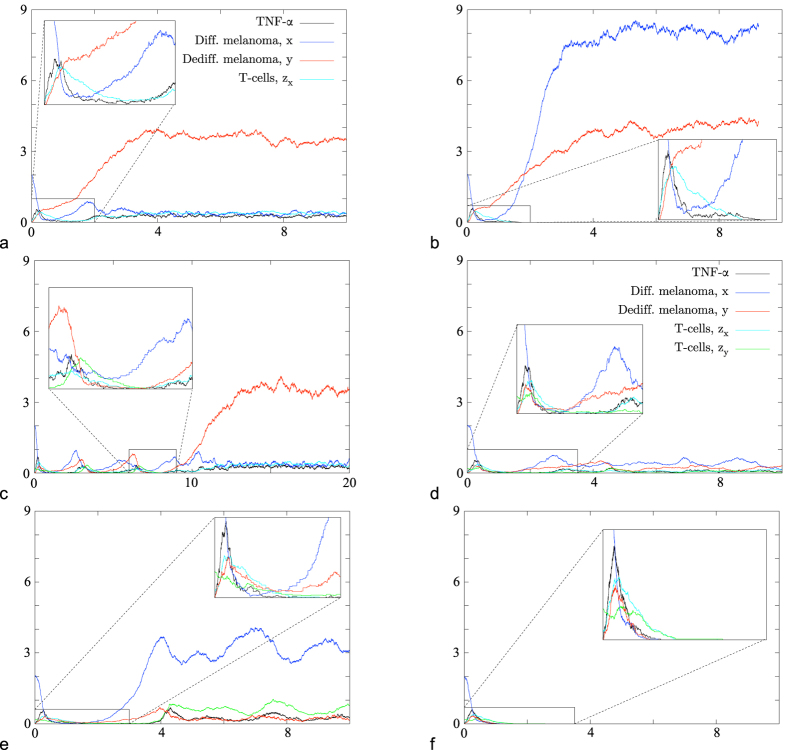
Figure 3. Simulations of the evolution of melanoma under T-cell therapy in the stochastic model for a fixed set of parameters.
The graphs show the number of individuals divided by 200 versus time. Two scenarios are possible for therapy with T-cells of one specificity: (a) T-cells zx survive and the system is attracted to  , or (b) T-cells zx die out and the system is attracted to Pxy00. Three additional scenarios are possible for therapy with T-cells of two specificities: (d) T-cells zx and zy survive and the system stays close to
  , (e) T-cells zx die out and the system is attracted to
  , (f) the tumour is eradicated (corresponding to P00000). (c) Transition between cases (a,d).

