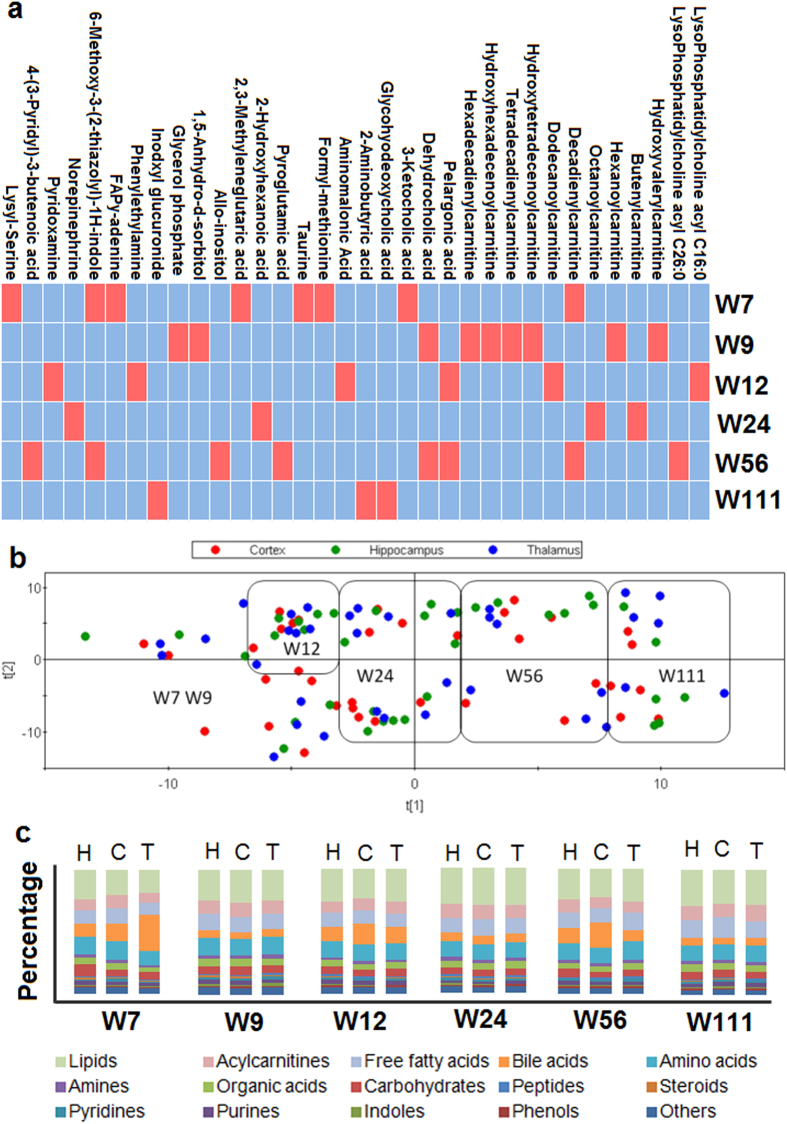
Figure 2. Regional variation of brain metabolome and comparison between age- and region-related variations.
(a) The grid diagram shows the metabolites with significant differences among the three brain regions at any time point. The red blocks indicate statistically significant differences (Kruskal-Wallis test, P < 0.05), and the blue blocks indicate no significant difference (Kruskal-Wallis test, P > 0.05). (b) Partial Least Squares Projection to Latent Structures (PLS) scores plot was generated based on the data from the three regions at different time points. This analysis shows clear discrimination by age, with little obvious regional discrimination. (c) The bar plots show the metabolite types of the three brain regions at different time points. H, hippocampus; C, cortex; T, thamalus.

