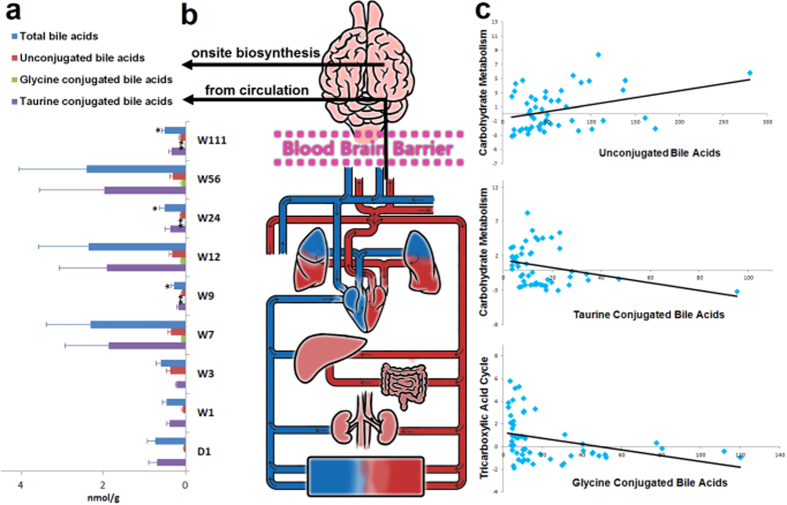
Figure 4. Bile acids in the brain.
(a) The bar chart shows the concentrations of total bile acids and three bile acid subtypes at different time points. The error bars indicate standard error. N = 6 for each group. *indicates P < 0.05, and **indicates P < 0.01 compared with W7 in Mann Whitney test. (b) The figure shows two possible sources of brain bile acids, i.e., blood circulation and onsite biosynthesis in the brain. (c) The scatter plots generated by Spearman correlation coefficient analysis illustrate that unconjugated bile acids were positively correlated with carbohydrate metabolism, and taurine conjugated bile acids and glycine conjugated bile acids were inversely correlated with carbohydrate metabolism and the tricarboxylic acid cycle, respectively.

