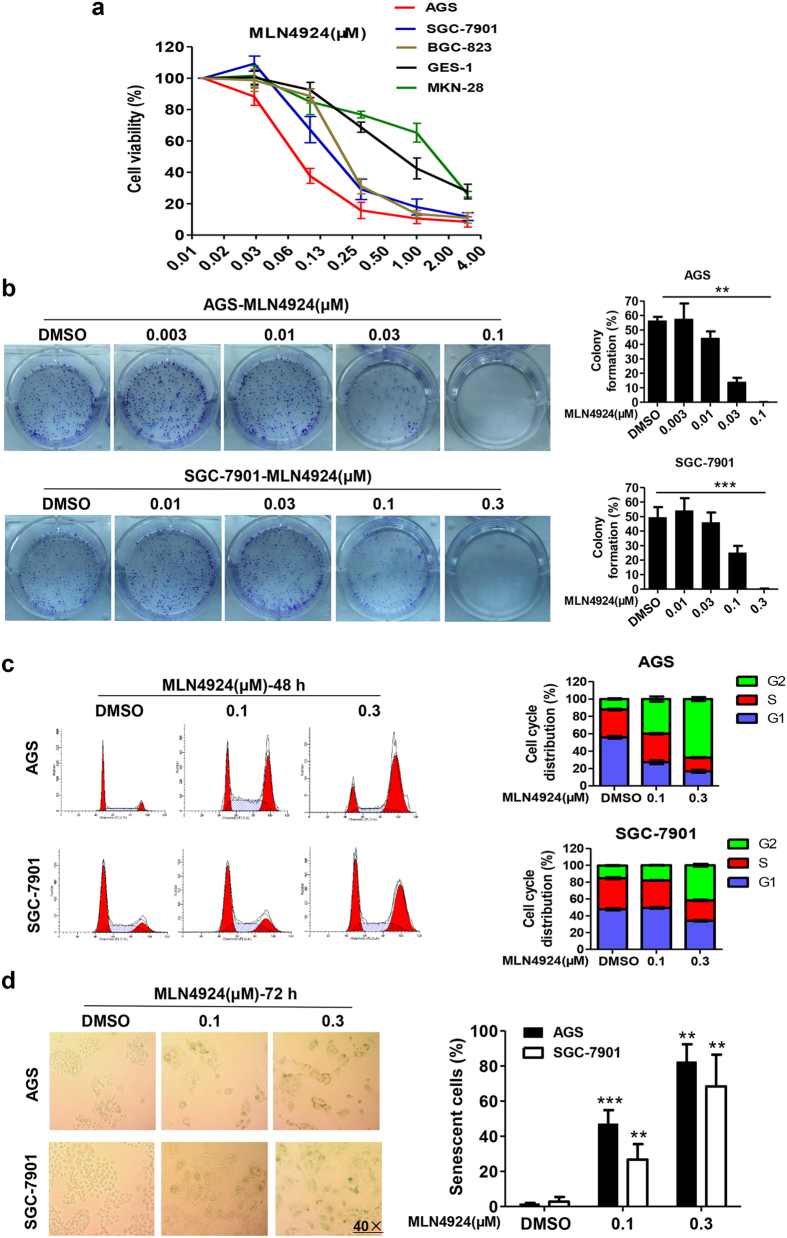
Figure 2. MLN4924 inhibited growth of gastric cancer cells by inducing G2-M arrest and senescence.
(a) Cells were seeded in triplicates in 96-well plate and treated with MLN4924 at various concentrations for 72 hrs, followed by ATP-liteproliferation analysis. Shown is mean ± SEM from three independent experiments. (b) Cells were seeded in 60 mm dish in triplicates and subjected to MLN4924 treatment at indicated concentrations for 10 days. Shown on leftare representative dishes, and on the left are mean ± SEM from three independent experiments. ***P < 0.001, **P < 0.01, two-tailed unpaired student’s t-test. (c,d) Cells were treated with DMSO control or MLN4924 at indicated concentrations for 48 hrs (c) or 72 hrs (d) before subjected to FACS analysis (c) or SA-β-Gal staining (d). Shown on the left is representative FACS profiling images (c) or cell staining images (d) and on the right is mean ± SD from three independent experiments. Photos on (d) were taken with Leica DM4000 at 40 × amplification.

