Fig. 4.
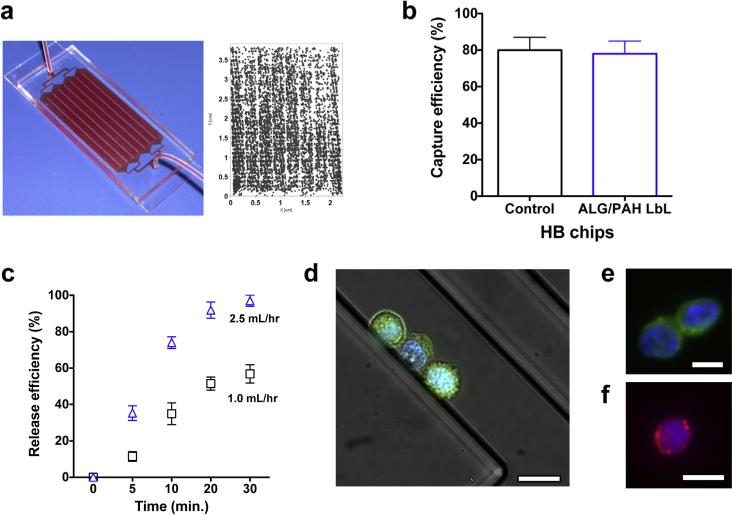
Capture and release of spiked PC-3 cells. (a) Left: optical image of whole blood flowing through an HBCTC-chip. The concentration of spiked PC-3 cells in whole blood was 5000/mL. Right: image shows a representative distribution of captured cells (shown as black dots) in the HBCTC-chip. The scale bar is 10 mm. (b) Capture efficiency of ALG/PAH modified HBCTC-chip in comparison with conventional HBCTC-chip. (c) Release efficiency at various degradation times and flow rates of enzyme solution. (d)–(f) Immunofluorescent staining of cell surface receptors for captured PC-3 cells in the HBCTC-chip (d), released PC-3 cells (e), and white blood cells (f), shown here is EpCAM expression in green, DAPI nuclear staining in blue, and CD45 expression in red. The scale bars are 20μm.

