Figure 2.
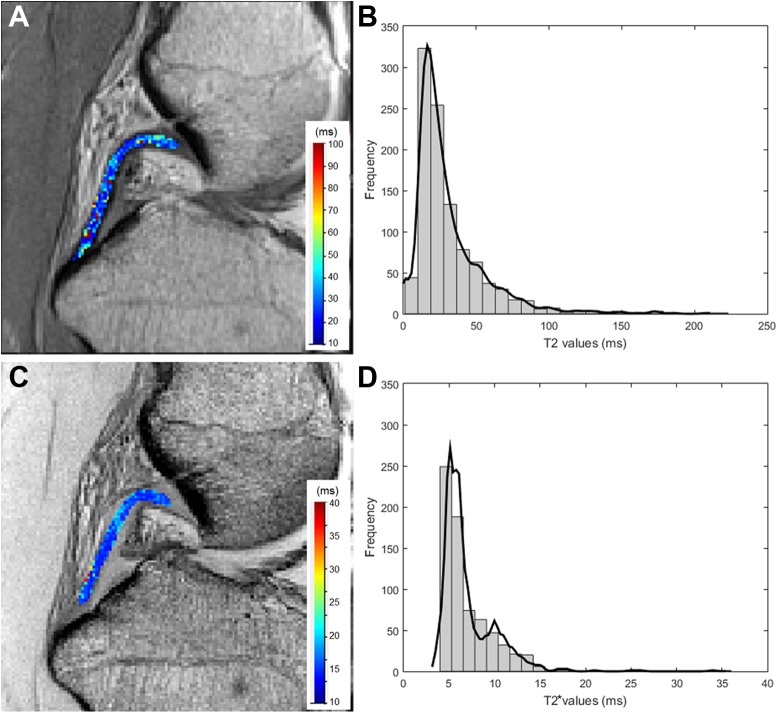
Example asymptomatic posterior cruciate ligament (PCL) showing (A) T2 mapping image slice, (B) histogram of T2 values for the entire PCL volume with a kernel distribution fit line, (C) T2* mapping image slice, and (D) histogram of T2* values for the whole PCL volume with a kernel distribution fit line.

