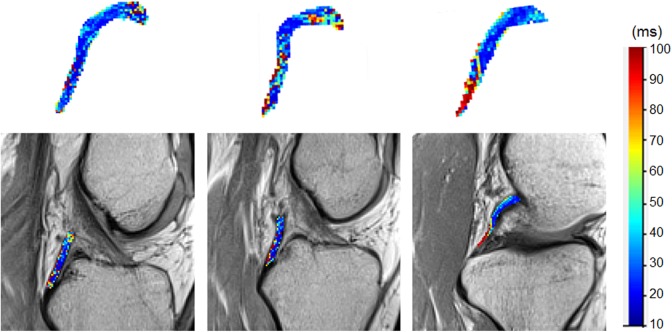
Figure 3.
Examples of subjects in which the distal posterior cruciate ligament (PCL) exhibited significantly higher mean, standard deviation, variance, and contrast of T2 mapping values compared with both the middle and proximal subregions (P < .05). The upper row displays the 3-dimensional PCL volume with voxels color-mapped to the T2 values (ms), and the lower row shows the corresponding T2 mapping image slice with the T2 values overlaid.

