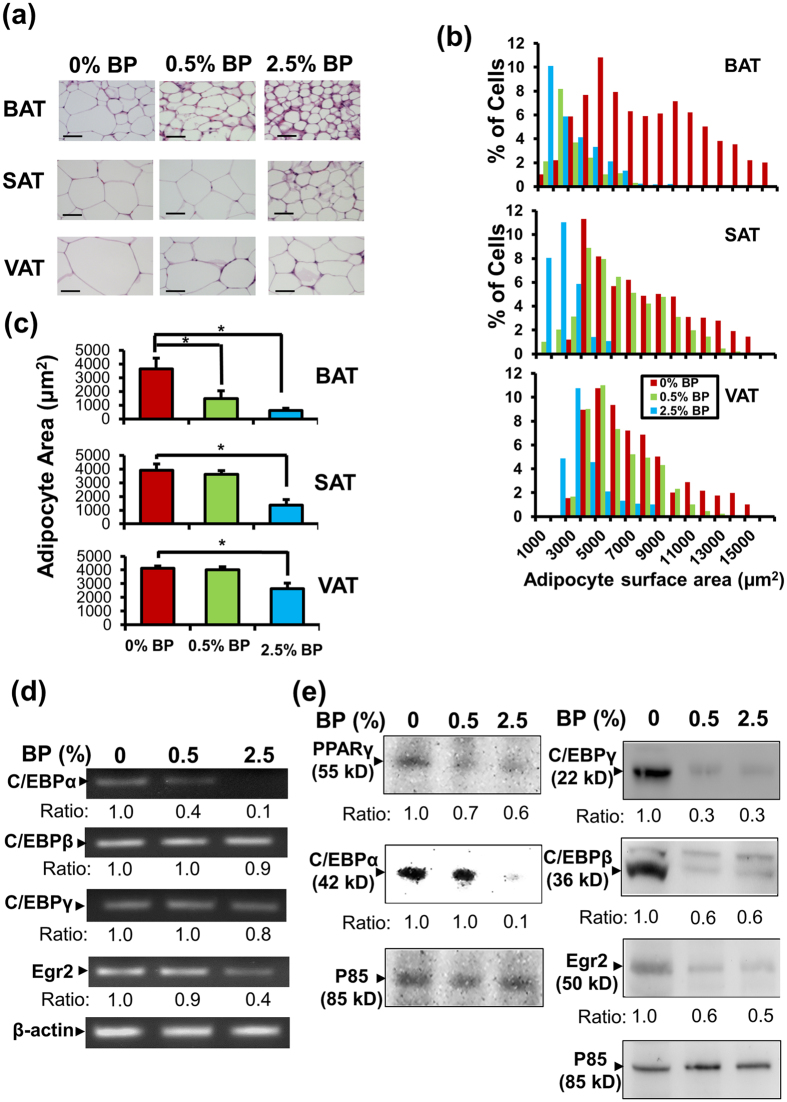
Figure 3. Morphological, cellular and biochemical changes in adipose tissues of male ob/ob mice fed B. pilosa.
(a–c) Brown (BAT), subcutaneous (SAT) and visceral (VAT) adipose tissues of the ob/ob mice (Fig. 1) were collected. The adipose tissues were stained with hematoxylin and eosin (a). The size distribution (b) and average area (c) of adipocytes in every 100-mm2 area range of adipose tissues were quantified using ImageJ software. The data, expressed as mean ± SEM, was analyzed using Student’s t-test. P < 0.05 (*) are considered statistically significant. (d,e) Both mRNA (d) and protein (e) level of Egr2, C/EBPγ, C/EBPβ, C/EBPα and PPARγ in visceral adipose tissue (VAT) of the ob/ob mice (Fig. 1) fed with different doses of B. pilosa was analyzed with RT-PCR and Western blot. The ratio of each gene product to that of internal control was calculated.

