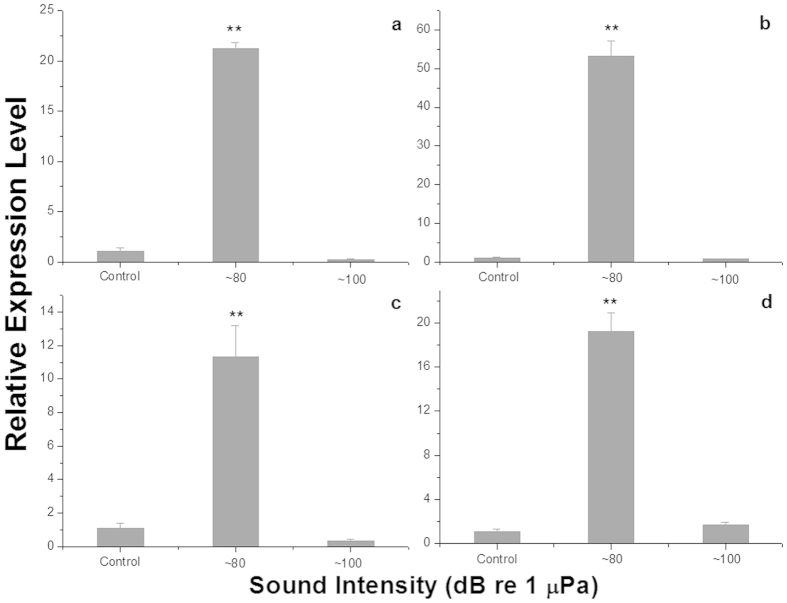
Figure 3. Relative gene expression levels for different sound intensity groups.
Relative gene expression levels (mean ± SE) of 6-phosphofructokinase-1 (a), pyruvate kinase (b), acetyl-CoA carboxylase (c), and arylformamidase (d) in razor clams exposed to one week of ambient sound or to ~80 dB re 1 μPa or ~100 dB re 1 μPa of underwater sounds (* and **indicate a significant and an extremely significant difference by t-test, respectively, relative to the control of ambient sound).

