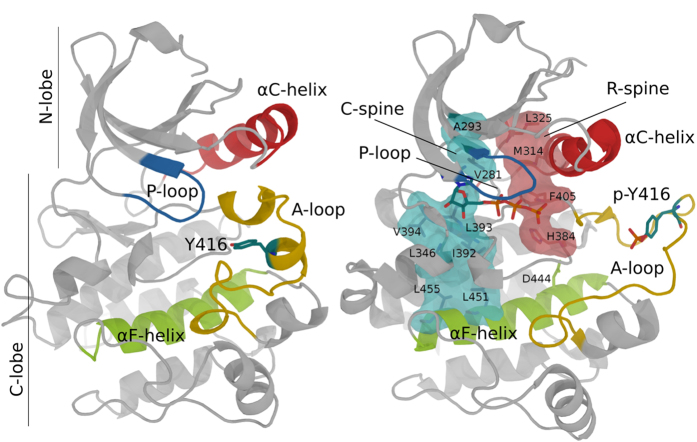
Figure 1. Comparison of inactive (Left, PDB id: 2SRC) and phosphorylated, active (Right, PDB id: 1YI6) crystal structures of the Src catalytic domain.
Key structural elements are colored in red (αC helix), blue (P-loop), yellow (A-loop) and green (αF helix). The (P)-Tyr416 and ATP are shown as sticks. The C- and R-spines are shown as surfaces (with inner residues as sticks) in cyan and pink, respectively.

