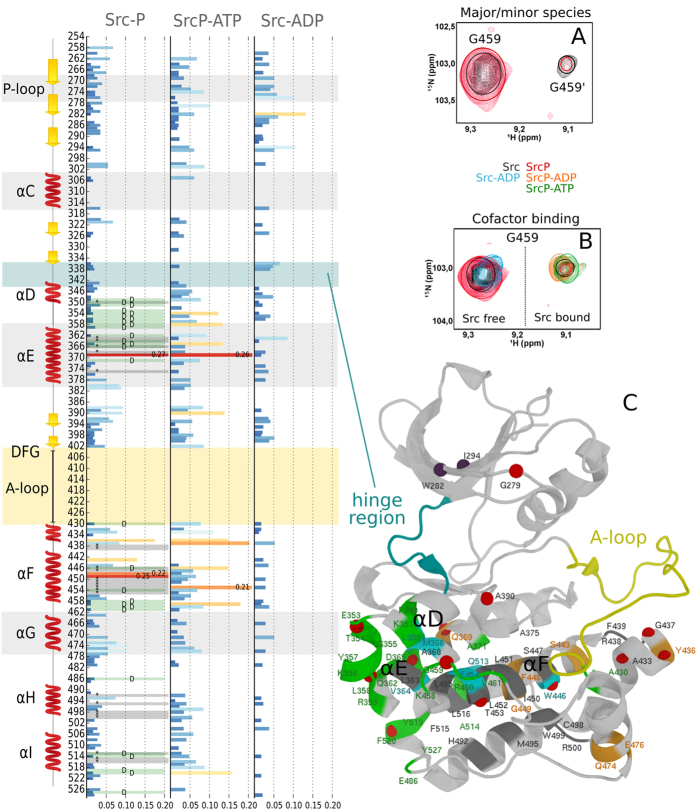
Figure 2.
(left panel) Combined chemical shift deviations of SrcP, SrcP-ATP and Src-ADP complexes with respect to free Src. Doubling of peaks is indicated with a letter D and a green bar, while peaks disappearing are reported with a * sign and a grey bar. (right panel) (A) Src (black) and SrcP (red) exists in two unevenly populated forms in solution as exemplified by G459 (but also by many other peaks highlighted in green in the structure) in the 1H,15N TROSY NMR spectrum; (B) the minor form (indicated by G459′ in A) becomes prevalent with the addition of the cofactor (ATP/ADP, green and orange) only if the protein is phosphorylated. Addition of ADP to free Src (light blue) forms a weaker complex causing only a small shift, even in excess of the ligand; (C) the crystal structure of Src (1YI6) showing the residues for which the doubling of peaks is apparent in green, peaks disappearing upon phosphorylation in grey and peaks that have a high deviation in SrcP in orange. Peaks with high deviation in SrcP-ATP and Src-ADP are also shown as red and purple spheres, respectively. Coloured circles in spectra have been added to better clarify the position of the peaks.

