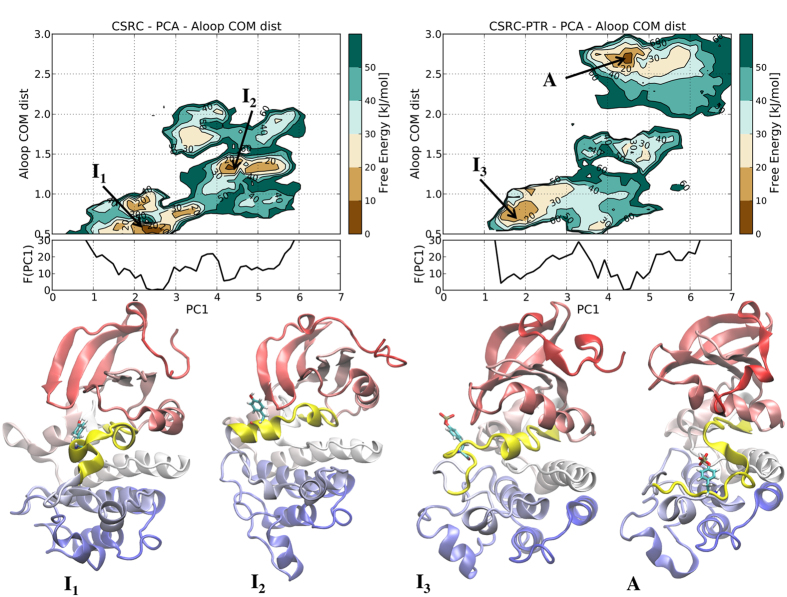
Figure 3. Free Energy Surfaces (FESs) of unphosphorylated Src (left) and phosphorylated Src (right) as a function of the first principal component vector (PC1) and the distance of the center of mass of A-loop residues 411–413 to residues 301–303. Below the bi-dimensional plots is shown the mono-dimensional free energy profile along PC1.
The central cluster conformations of the main FES minima (the inactive-like, I1, I2 and I3 and active-like, A, structures respectively) are also reported with the A-loop colored in yellow and the Tyr416 (or P-Tyr416 in case of phosphorylated Src) shown with sticks.

