
Figure 3.
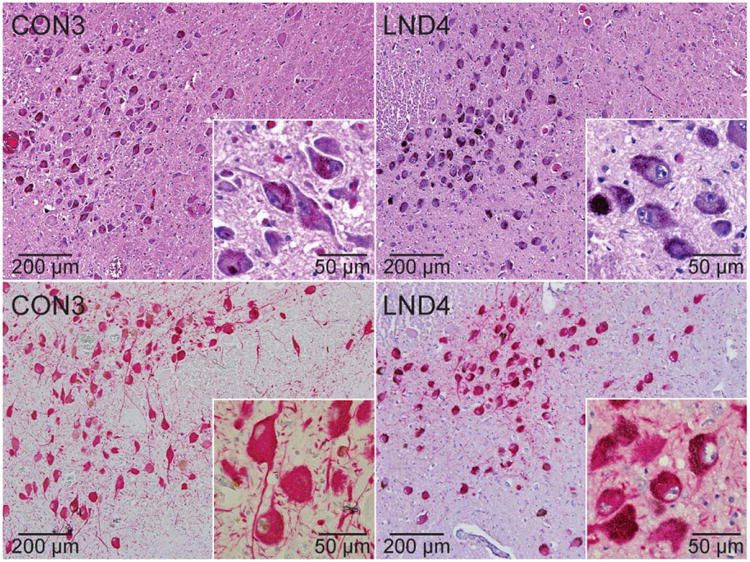
Brainstem locus coeruleus. Representative stains of brainstem locus coeruleus sections from a control (CON3) and LND patient (LND4) are shown. In at least 3 independently stained sections, the LND brains showed normal numbers and sizes of neurons in hematoxylin and eosin (upper panels) or tyrosine hydroxylase (TH)-immunostained sections (lower panels), normal melanin pigmentation, and normal TH immunostain intensity.