
Figure 5.
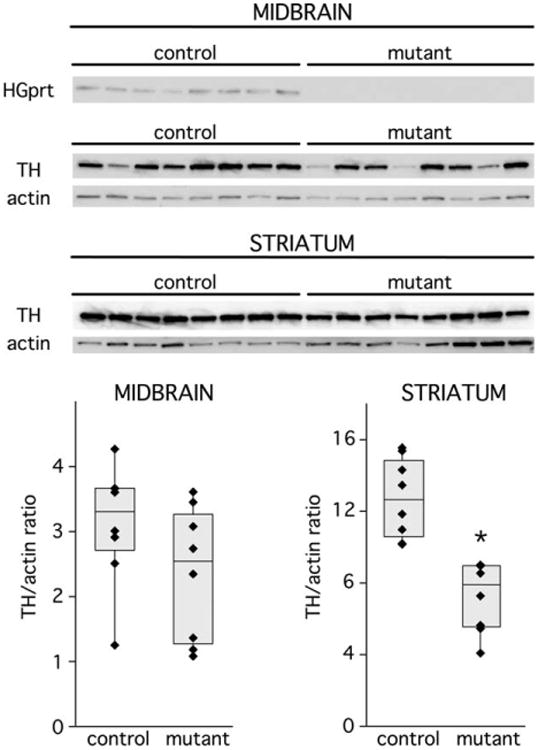
Quantitative immunoblots for tyrosine hydroxylase (TH) in midbrain and striatum. The relative abundance of TH and actin as a loading standard are shown for immunoblots of midbrain and striatum. The left 8 lanes show results for 8 independent hypoxanthine-guanine phosphoribosyltransferase–positive (HGprt+) control mice, and the remaining 8 lanes show results for independent HGprt− mice. TH band intensities were normalized to actin in midbrain (bottom left) and striatum (bottom right); each value for each animal is presented as a separate symbol, with superimposed box-whisker plots to show median (center line), confidence intervals (top and bottom bar), and entire data range (whiskers). Results were examined by 2-way analysis of variance with brain region and HGprt status as explanatory variables. This analysis revealed significant differences between the normal and HGprt− mice for the striatum (*p < 0.001) but not the midbrain (p > 0.10). This experiment was repeated with 4 additional mutants and controls on an independent occasion for a total of 12 different control and HGprt− mice, with results similar to those shown here.