
Figure 6.
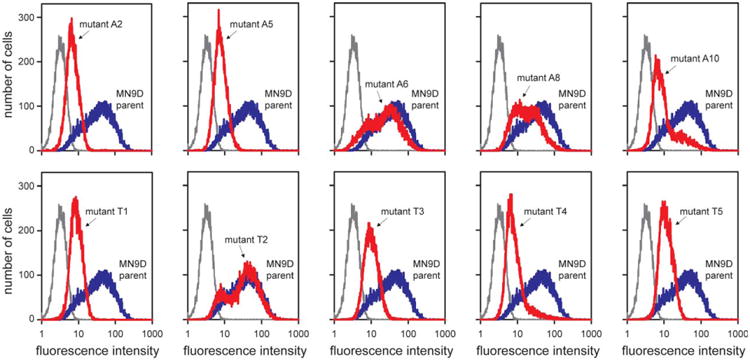
Tyrosine hydroxylase immunostains of the MN9D cell model of hypoxanthine-guanine phosphoribosyltransferase (HGprt) deficiency. Fluorescence intensity histograms from flow-activated cell sorting analyses are shown as separate panels for each of the HGprt− MN9D subclones (red traces) along with the HGprt+ MN9D parent cell line as control (blue traces) and a negative control without primary antibody (gray traces). Summary statistics for each mutant line (A2, A5, A6, A8, A10, T1, T2, T3, T4, and T5) are provided in Table 2. The results show representative traces, with the entire experiment being repeated at least 3 independent times.