Fig. 2.
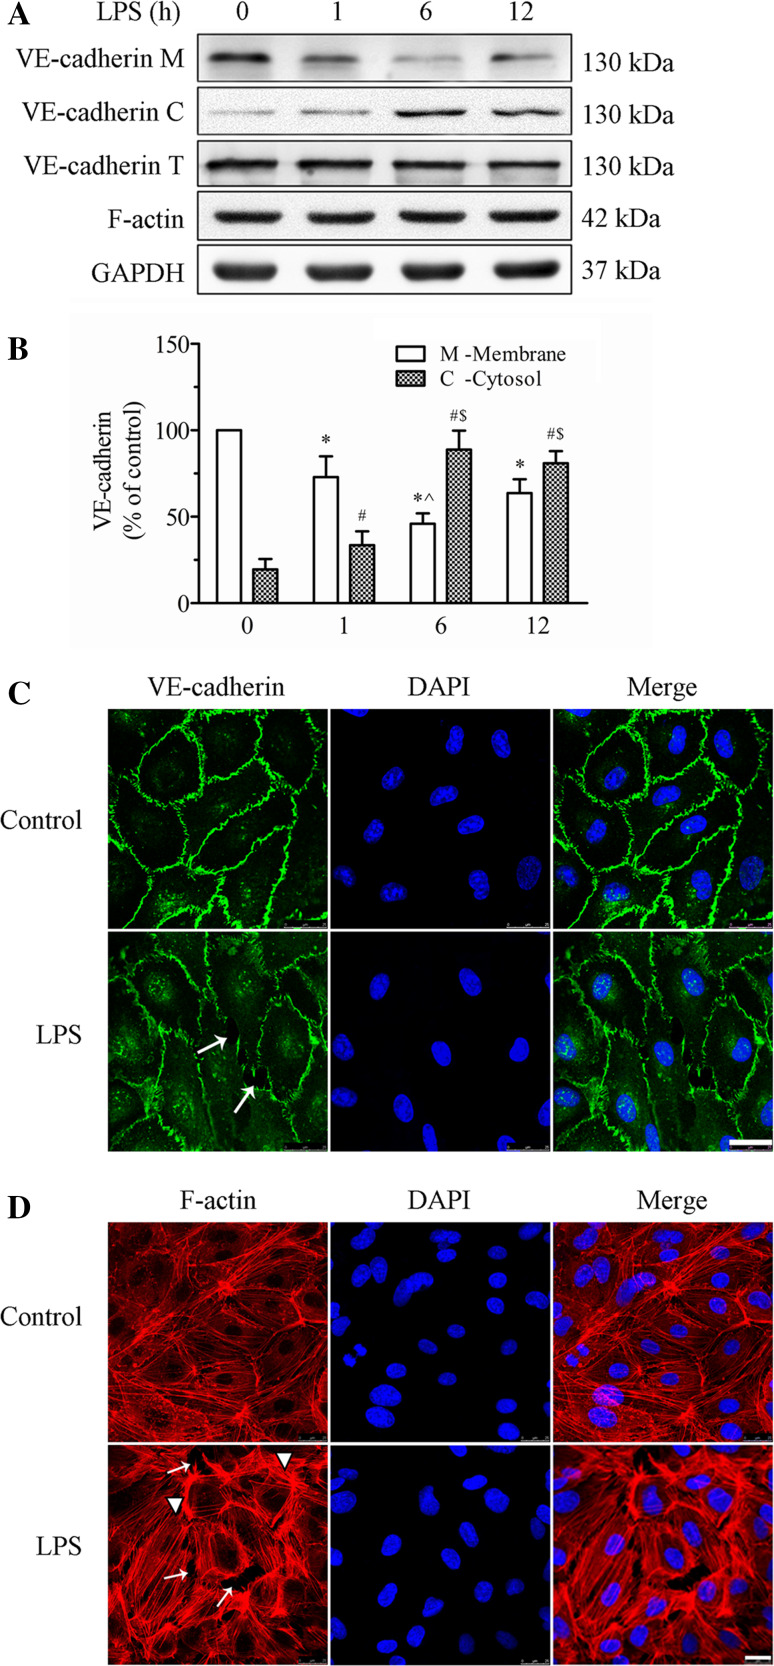
Effect of LPS on the expression and localization of VE-cadherin and the actin cytoskeleton in HPMECs. a The expression levels of the VE-cadherin and F-actin in the membrane and cytosol fractions and whole cell lysate were detected by WB. Representative blots showing the expression of VE-cadherin in the cell membrane (upper panel), in the cytosol (2nd panel), and in the whole cells (3rd panel), and the expressions of F-actin (4th panel) and GAPDH (lower panel) are shown. HPMECs were treated with 1 μg/ml LPS for various time intervals. b Histogram showing the quantification of VE-cadherin in the membrane fraction (white bars) and in the cytosol fraction (grid bars) from three independent experiments. The data are presented as the mean ± SE *p < 0.05 versus the 0 h membrane group, ^ p < 0.05 versus the 1 h membrane group; # p < 0.05 versus the 0 h cytosolic group, $ p < 0.05 versus the 1 h cytosolic group. c, d Confocal microscopic analysis of VE-cadherin (c) and F-actin (d) in HPMECs after LPS treatment. HPMECs were cultured on Transwell inserts for 5–7 days. The HPMECs were grown to about 90 % confluence. They were stimulated with 1 μg/ml LPS for 6 h and imaged by confocal laser scanning microscopy (CLSM). Green indicates cells labeled with VE-cadherin; red, F-actin; blue, DAPI. Arrows indicate intercellular gaps and arrowheads indicate fibers. Scale bar 25 µm. The photographs represent three separate experiments

