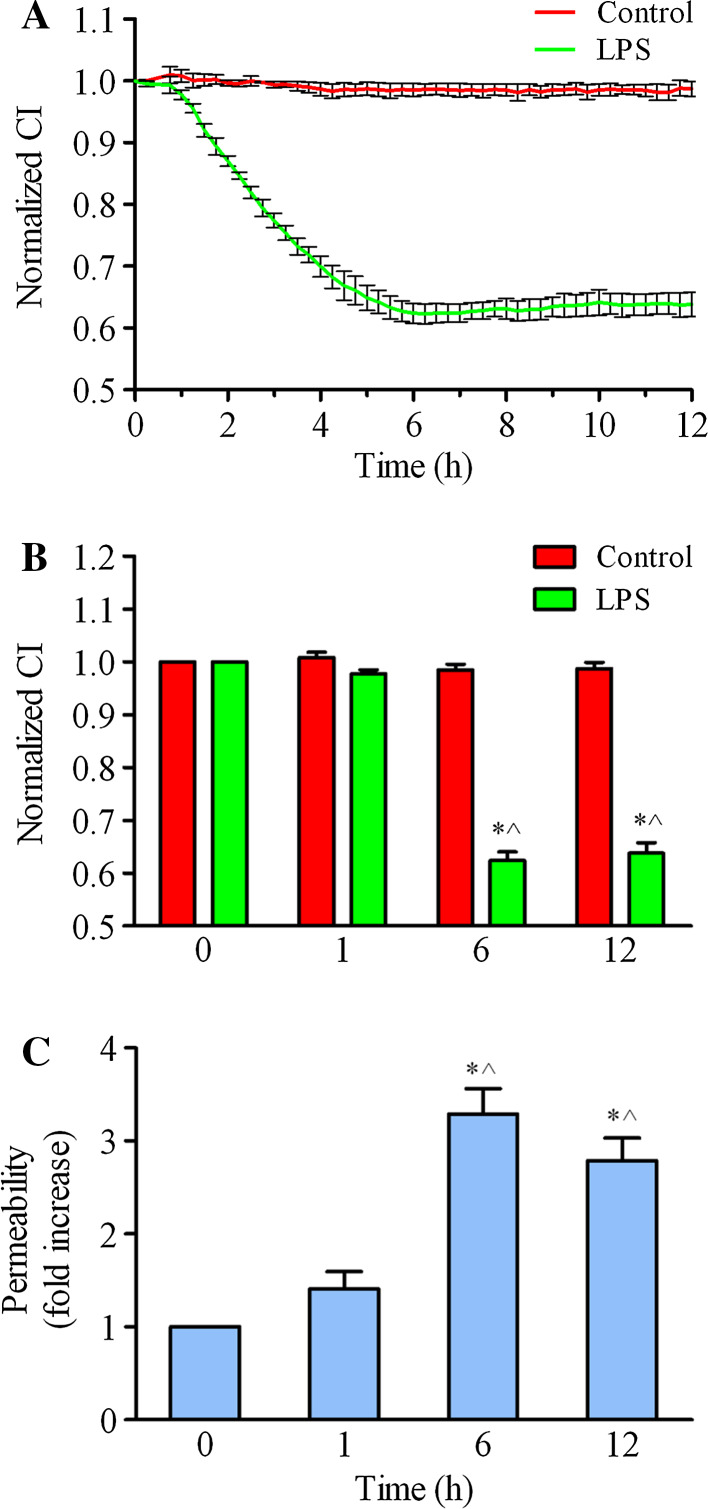
Fig. 3.
HPMEC barrier dysfunction after LPS treatment. a HPMECs were cultured and stimulated with LPS at 1 μg/ml, and real-time cell growth curves were subsequently observed and taken from four independent experiments using the iCELLigence system. b A time histogram shows the normalized cell index (CI) with LPS treatment for 1, 6, and 12 h. The data are presented as the mean ± SE. n = 4, *p < 0.05 versus the 0 h group, ^ p < 0.05 versus the 1 h group. c HPMECs were grown to confluence on 0.4-μm Transwell inserts and stimulated with 1 μg/ml LPS for different time intervals (1, 6, and 12 h). FITC-dextran was added to the upper wells at a concentration of 1 mg/mL. After 0.5 h of incubation, 50 μl of medium from the bottom chamber was aspirated and measured in a fluorescence plate reader. The FITC-dextran permeability is expressed as the fold increase ±SE (n = 3). *p < 0.05 versus the 0 h group, ^ p < 0.05 versus the 1 h group

