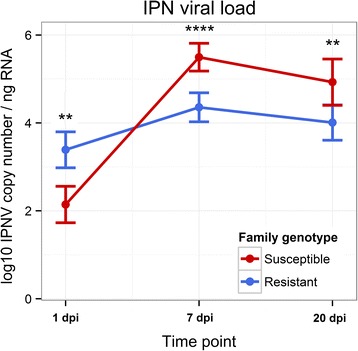
Fig. 3.

IPNV viral load in resistant and susceptible families. Mean and standard error log10 IPNV copy number per ng total RNA for resistant and susceptible samples at 1, 7 and 20 days post infection. Significance symbols correspond to the p-values for Mann–Whitney U test between resistant and susceptible samples (* p ≤ 0.05; ** p ≤ 0.01; *** p ≤ 0.001; **** p ≤ 0.0001)
