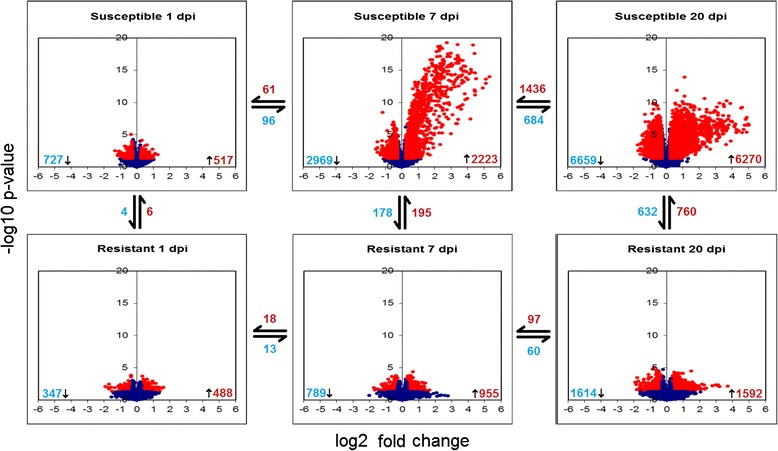
Fig. 4.

Volcano plots of global gene expression response in resistant and susceptible families following IPNV challenge. Volcano plots of the log2 fold change vs. log10 p-value of every transcript for each of the six comparisons are shown. Transcripts with p values < 0.05 (significant) are shown in red, while those with p values > 0.05 are shown in blue. The number of significant down-regulated (blue) and up-regulated (red) transcripts for each comparison are shown in the corners of each volcano plot. Likewise, the number of common down-regulated and up-regulated genes between each comparison are shown in the space between their volcano plots
