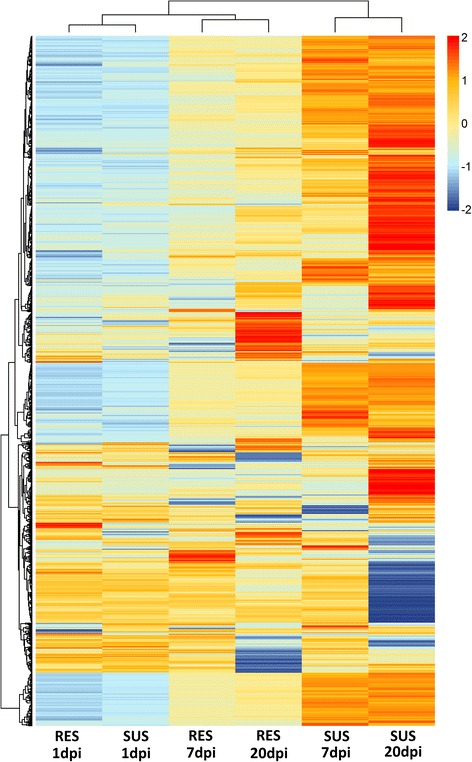
Fig. 5.

Heatmap of differentially expressed genes in resistant and susceptible families. Heatmap showing the expression of all the differentially expressed genes with log2 fold change > 1 in any of the six comparisons and the clustering of the susceptible and resistant samples at 1, 7 and 20 days post infection
