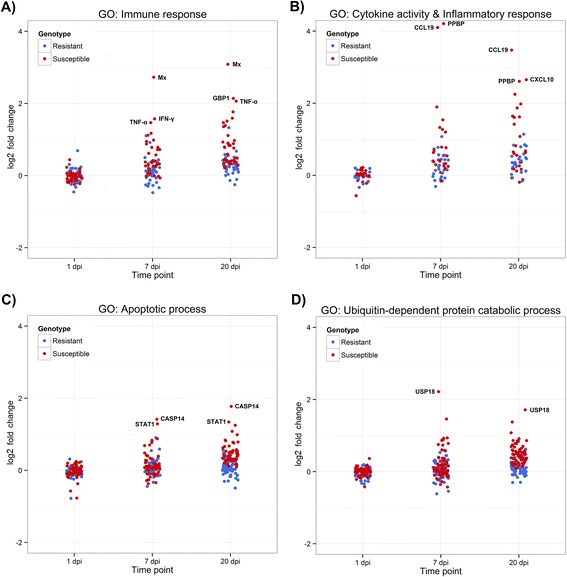
Fig. 6.

Scatterplots of gene expression for selected enriched GO terms. Scatterplots showing the log2 fold change values of genes differentially expressed at any of the six comparisons and annotated with the GO terms: a “immune response”, b “cytokine activation” and “inflammatory response”, c “apoptotic process”, and d “ubiquitin-dependent protein catabolic process”
