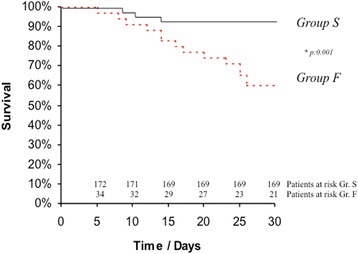
Fig. 1.

Time to event curves for 30-day survival. Events were calculated with the use of Kaplan Meier methods and were compared using Log rank test. Number of patients at risk is indicated for both groups. Group S denotes patients with successful fast-track protocol after TA-TAVI, whereas Group F represents those patients with fast-track management failure
