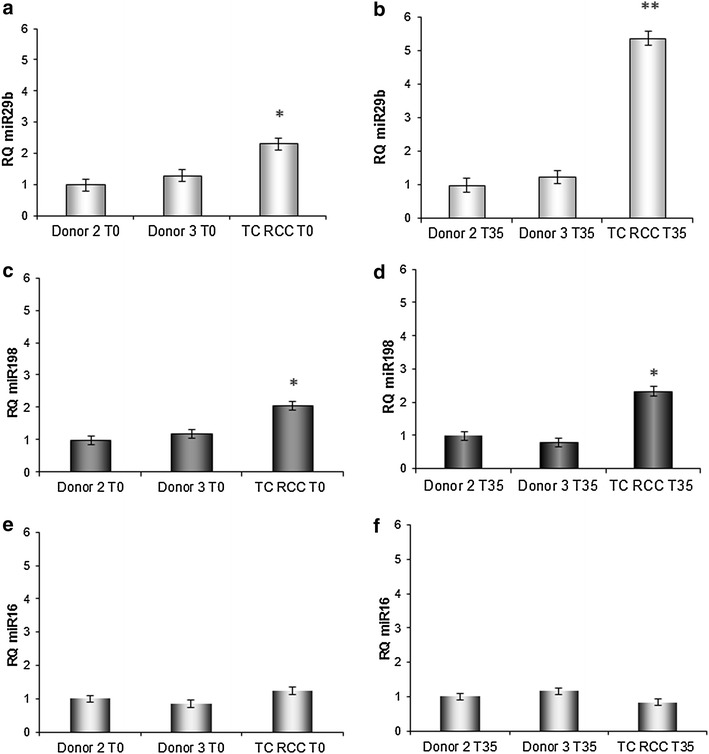
Fig. 4.

CD8+ T cells isolated from RCC patient TC express elevated levels of miR-29b and miR-198 when compared to normal donor T cells. Real-time PCR analysis of mir-29b (panels a, b) and mir-198 (panels c, d) expression in CD8+ T cells from TC RCC and both HLA-matched normal donors, at day 0 (T0; panels a, c) and after 35 day of stimulation (T35; panels b, d). *p < 0.05 for RCC patient TC versus normal donors at T0. **p < 0.005 and *p < 0.03 for RCC patient TC versus normal donors at T35. Data are representative of 3 independent experiments performed. miR16 expression in CD8+ T cells from TC RCC and both HLA-matched normal donors at T0 (e) and T35 (f)
