Fig. 1.

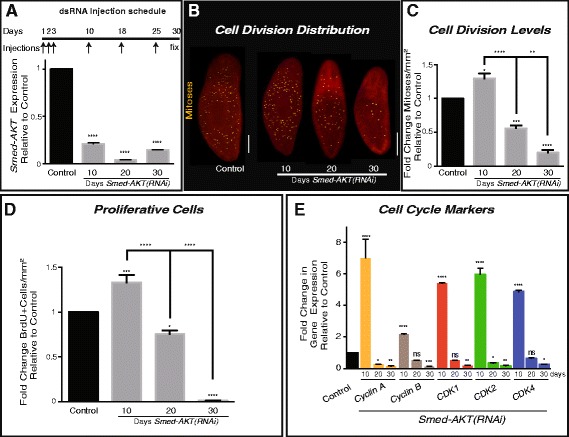
Downregulation of Smed-Akt(RNAi) reduces neoblast proliferation. a The dsRNA microinjection schedule is depicted on top. A total of 6 injections (arrows) were performed during a 30 day (black line) period. The RNAi efficiency of the dsRNA microinjections was tested with quantitative PCR(qPCR) on days 10, 20 and 30 after the first dsRNA injection, showing significant down-regulation relative to control. b Whole-mount immunostaining of control and Smed-AKT(RNAi) worms, using anti-phosphorylated histone H3 (H3P) antibody to label the distribution of cell division at days 10, 20 and 30 after first dsRNA injection. Yellow dots represent mitotic cells. Scale bar 200μm. c H3P-signal quantification, represents fold change of cell division (mitoses per mm2) relative to the control at days 10, 20 and 30 after Smed-AKT(RNAi). A significant increase in cell division was observed 10 days post first injection, which dramatically diminishes by day 30. d Quantification of fold change in bromodeoxyuridine (BrdU) positive cells relative to the control at days 10, 20 and 30 after first injection. e Relative levels of gene expression, fold change, of cell cycle markers 10, 20 and 30 days after first Smed-AKT(RNAi) injection. All analyses were performed using two or more experimental sets with 10 or more animals per experiment at various time points after first dsRNA injection. For qPCR analysis, gene expressions are relative to the ubiquitously expressed clone H.55.12e. Graphs represent mean ± s.e.m. of three of more independent experiments. P values *** < 0.005 and **** < 0.0001, were calculated by two way ANOVA
