Fig. 7.

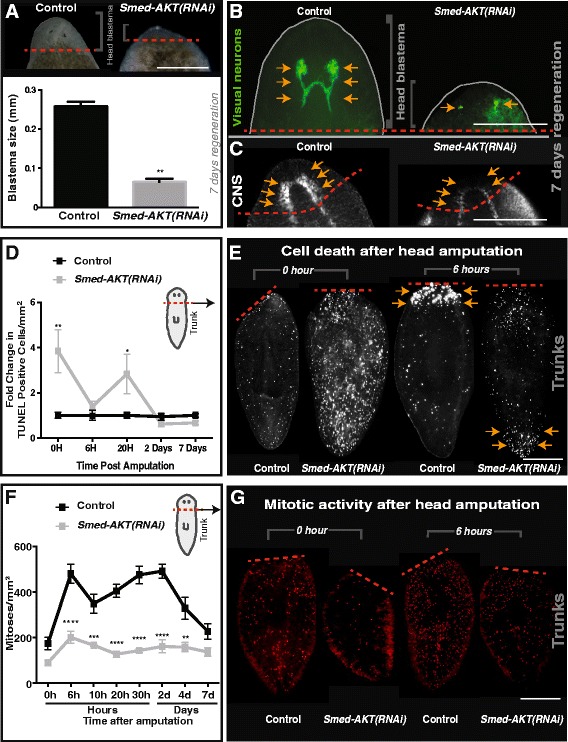
Akt is required for tissue regeneration. a Live images of control and Smed-Akt (RNAi) head blastema formation seven days post amputation. Dashed red line represents the amputation plane. Scale bar 100μm. b Immunostaining labeling the visual neurons (anti-VC-1 antibody) and (c) central nervous system (anti-SYNORF1 antibody) seven days post amputation. Arrows highlight these structures in both the control and Smed-Akt (RNAi) animals and red dotted lines represent the plane of amputation. Scale bar 100μm. d TUNEL-positive nuclei post amputation, represented in fold change compared to the control. Note that cell death decrease over time, a four fold difference in Smed-Akt (RNAi). e Immunostaining of TUNEL-positive nuclei of trunk fragments 0 and 6 h post amputation. Scale bar 200 μm. f Levels of H3P positive cells over time post amputation in control and Smed-Akt (RNAi). The quantification was performed on the regenerating trunk fragment. g Representative images showing mitotic activity (red dots) after head amputation at 0 and 6 h in trunk fragments. All images are representative of two or more biological replicates consisting of five animals or more per experiment. Scale bar 200 μm. Graphs represent mean ± s.e.m. of two or more biological replicates and P values *<0.01, **<0.001, ***<0.0005 and ****<0.0001 were obtained with Wilcoxon test or two way ANOVA
