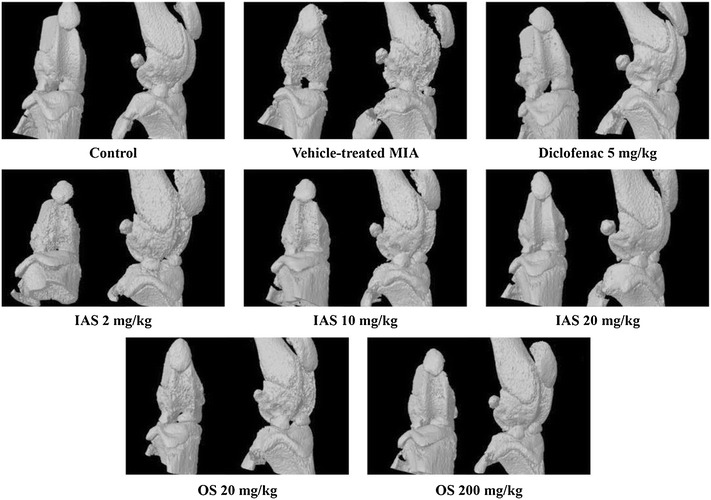
Fig. 1.

Roentgenograph analysis of the knee joint after treatment of SHINBARO in MIA-induced OA rat model. Micro-cartilage and patellae of the normal and experimental animals were scanned with microCT (Skyscan1076). Data represent as the mean ± SD (n = 6). IAS intra-articular SHINBARO, OS oral SHINBARO
