Fig. 2.

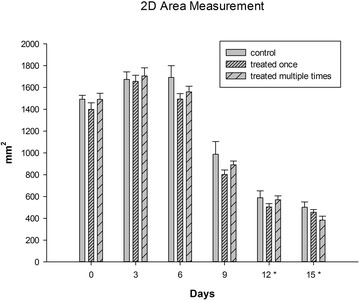
Graph of mean wound surface area for control, single and multiply treated wounds at each measured time point; error bars represent standard deviations, asterisks indicate significant differences from time 0 (P ≤ 0.001)

Graph of mean wound surface area for control, single and multiply treated wounds at each measured time point; error bars represent standard deviations, asterisks indicate significant differences from time 0 (P ≤ 0.001)