Fig. 4.
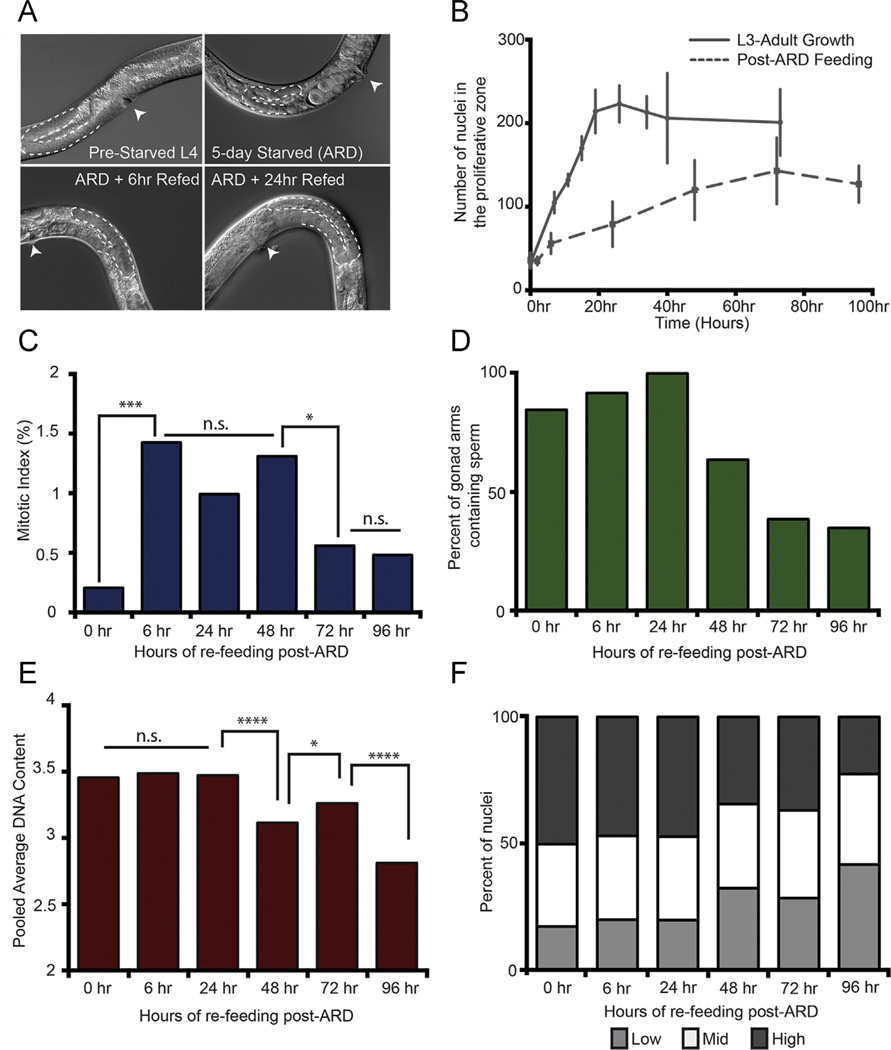
The post-ARD regenerating proliferative germ line recapitulates a subset of features of larval germ line development (A) Differential Interference Contrast (DIC) images of ARD and recovery upon re-feeding. The 5-day starved panel represents “0 hour” time point in subsequent panels. (B) The number of nuclei in the proliferative zone (Y-axis) of adult wild-type animals over time upon re-feeding. The curve for “L3-Adult Growth” is adapted from Fig. 1A to compare with post-ARD regenerative growth such that both curves start at approximately the same average number of proliferative zone nuclei: 36 for ARD and 32 for well-fed larvae. X-axis is time in hours as well as normal larval growth. The ‘0 hour’ time point for post-ARD re-feeding is therefore matched to a ‘32 hour post-hatching’ time point. Error bars are 1 standard deviation at each time point. N gonad arms for each time point are as follows: 0 h N = 16; 2 h N = 7, 6 h N = 20, 24 h N = 23, 48 h N = 11, 72 h N = 22, and 96 h N = 21. Panels C–F are time course analyses of (C) mitotic index, (D) penetrance of gonad arms containing sperm, (E) pooled average DNA content and (F) overall DNA content separated into Low, Mid and High DNA content bins (See Methods and materials). N gonad arms and n nuclei for each time point are as follows. For (C), 0 h, N = 16, n = 580; 6 h N = 20, n = 1138, 24 h N = 23, n = 1821, 48 h N = 11, n = 1319, 72 h N = 22, n = 2795, and 96 h, N = 21, n = 2679. For (D), 0 h N = 13, 6 h N = 12, 24 h N = 8, 48 h N = 10, 72 h N = 13, and 96 h N = 23. For (E) and (F), 0hr, N = 12, n = 408; 6 h N = 11, n = 558, 24 h N = 8, n = 427, 48 h N = 11, n = 967, 72 h N = 10, n = 1021, and 96 h, N = 7, n = 972. Statistics: two-tailed Mann–Whitney U test was used to compare between time points in panels C and E. *0.05≥p ≥ 0.01, ****0.00001 ≥ p ≥ 0.0001.

