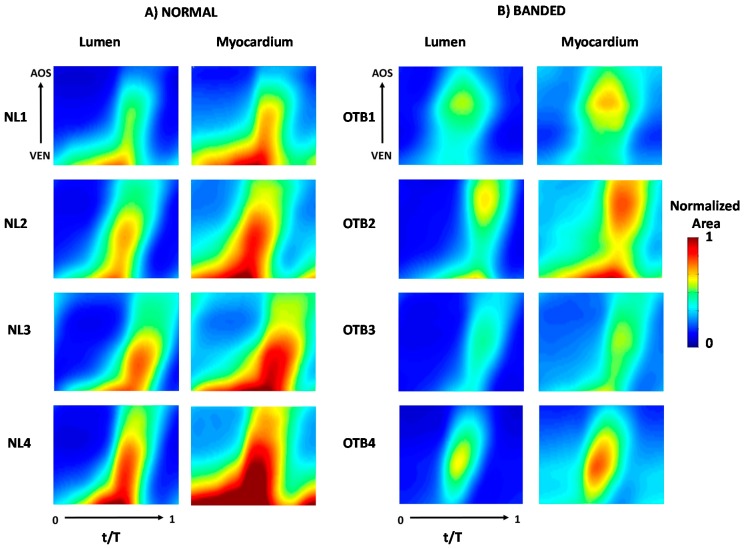
Figure 5.
2D area plots of the OFT lumen and myocardium. The plots compare the motion of (A) four normal (NL); and (B) four banded (OTB) embryos. In each plot, the x-direction (horizontal direction) indicates normalized time over the cardiac cycle, with t time and T cardiac cycle period; the y-direction (vertical direction) indicates normalized length along the segmented portion of the OFT from the section closer to the ventricle (VEN) to the section closer to the aortic sac (AOS), which determines the end of the OFT. Areas are normalized to the maximum lumen area of the normal embryos (occurring for NL4), and, thus, the maroon color features saturation (area > 1) for some myocardium plots. The data shows biological variations among embryos as well as the effects of banding on OFT wall motion. It is evident that the band does not merely constrict the lumen area, but its placement affect cardiac wall motion and mechanics.

