
Figure 9.
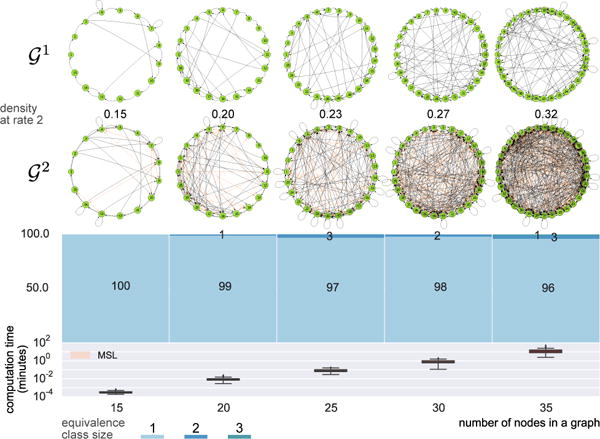
Graphs with 15, 20, 25, 30, and 35 nodes at the density of 10%, their corresponding and equivalence class size distribution as well as the running time summarizing the computation of 100 random SCCs per node size.
Official websites use .gov
A
.gov website belongs to an official
government organization in the United States.
Secure .gov websites use HTTPS
A lock (
) or https:// means you've safely
connected to the .gov website. Share sensitive
information only on official, secure websites.
Graphs with 15, 20, 25, 30, and 35 nodes at the density of 10%, their corresponding and equivalence class size distribution as well as the running time summarizing the computation of 100 random SCCs per node size.