
Figure 3.
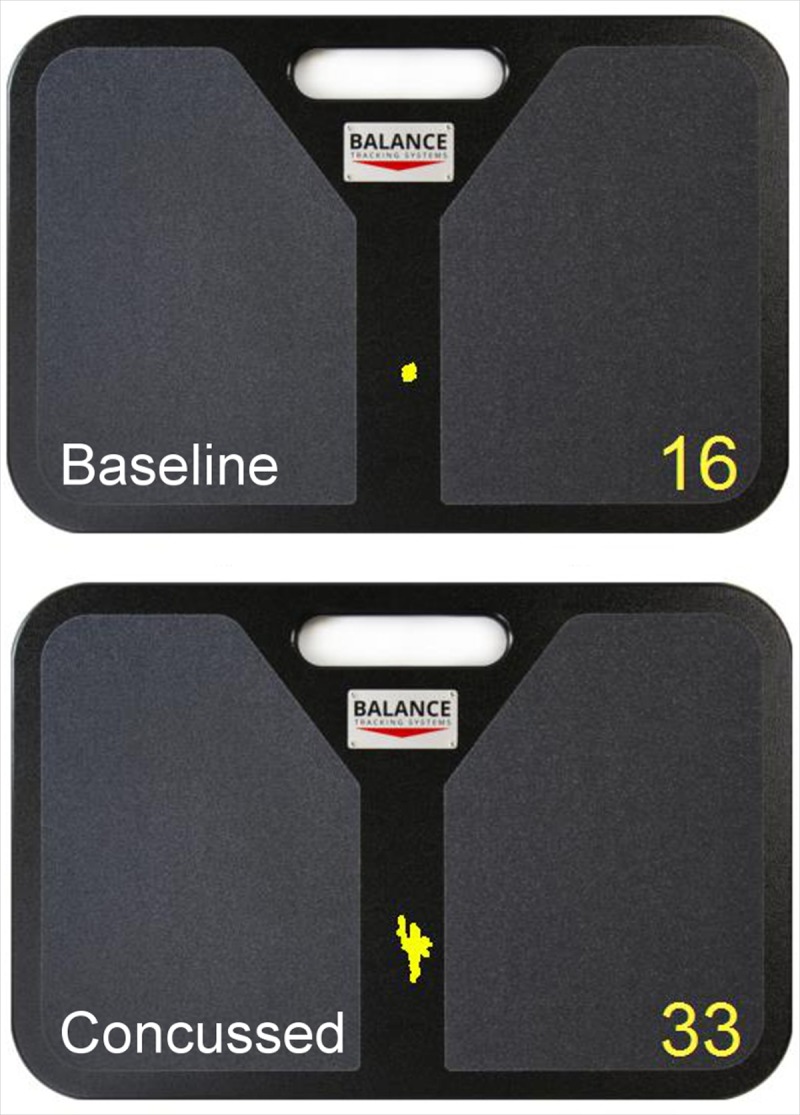
Example baseline (top) and post-concussion (bottom) COP data from a single BBT trial. The amount of body sway is shown by the path length (i.e. excursion) of the yellow COP trace, which is quantified in centimeters in the bottom right hand corner of each respective depiction of the BTrackS Balance Plate. Note the increase in COP path length following concussion.