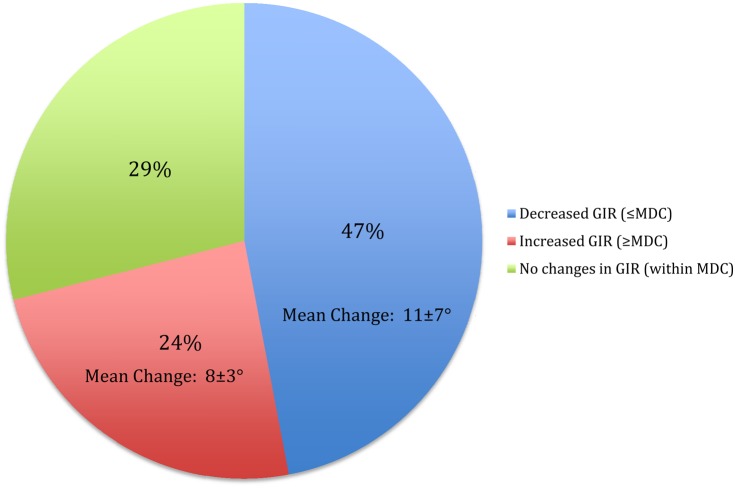
Figure 3.
This figure represents the percentages of players that decreased beyond MDC, increased beyond MDC, or stayed within MDC with respect to glenohumeral internal rotation from TP1 to TP3. The mean change is represented by the mean ± standard deviation measured in degrees, and signifies the players that demonstrated decreased or increased GIR outside the MDC of 4 °.

