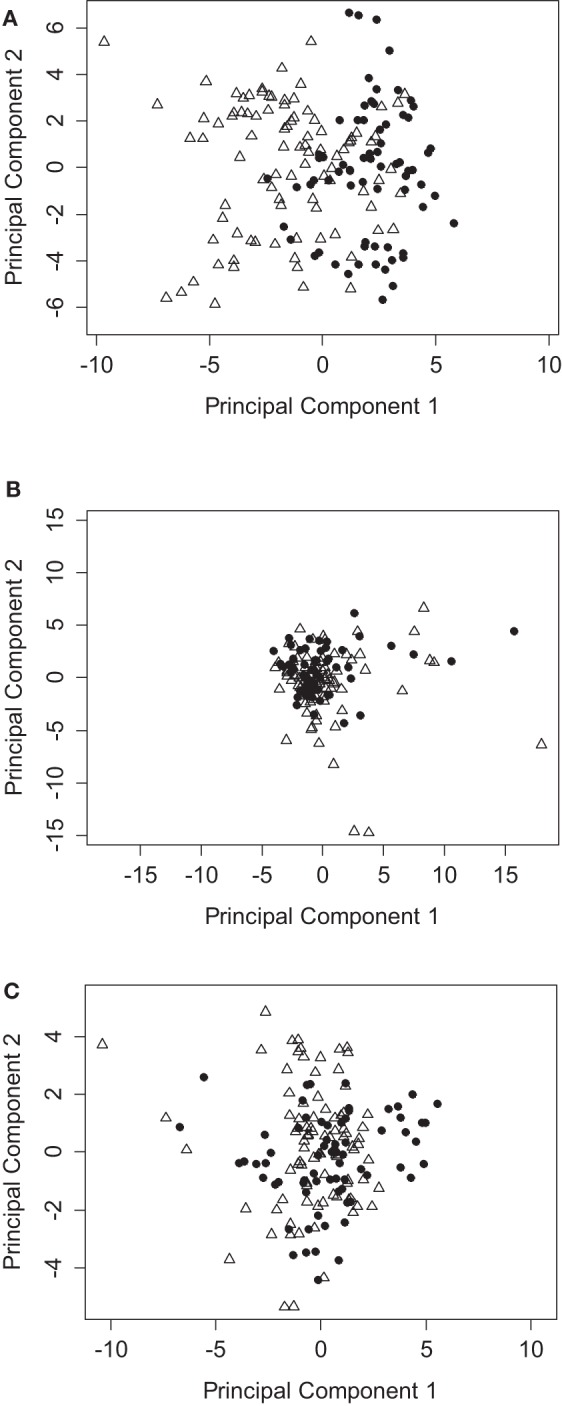
Figure 2.

PCA analysis of immunophenotyping data segregates between patients with or without rejection episodes. (A) PCA using all data points from the T cell immunophenotyping panel, showing the coordinates of samples from patients who reject (triangles) compared to those who do not reject (circles). (B) As for (A), but all data points are normalized to pretransplant baseline values. (C) As for (A), but using the NK, iNKT, and γ/δ T cell immunophenotyping panel.
