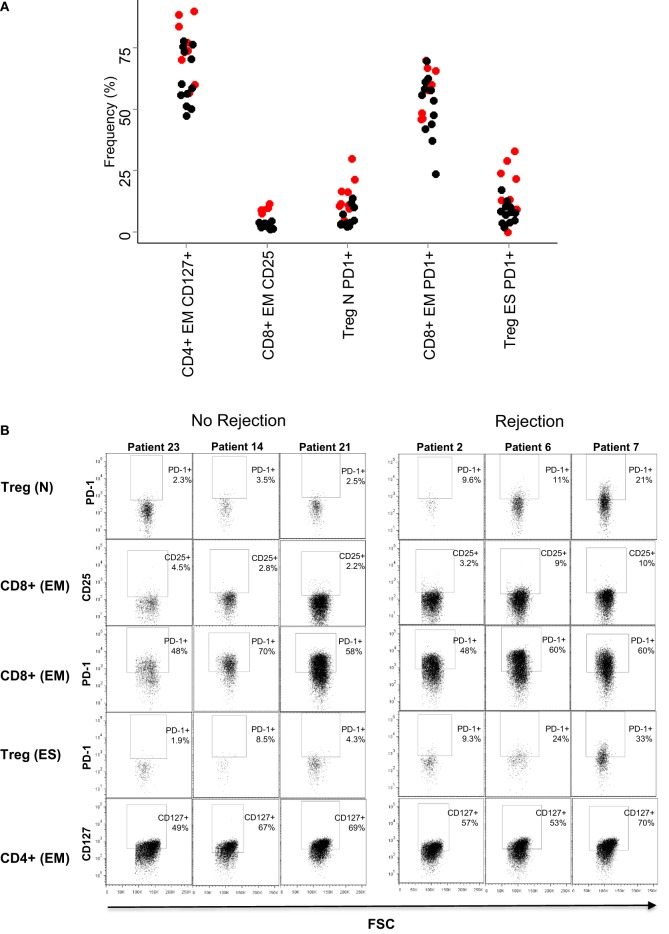
Figure 5.
Baseline frequencies and flow cytometry profiles of the subsets with largest coefficients in the SVM. (A) Relative frequencies (% of parent population) of the five T cell subsets with largest SVM coefficients. The result for each patient is shown as a circle (red for rejectors, black for non-rejectors). Significance values (Mann–Whitney with Bonferroni correction) for the five subsets are: PD1+ naive Treg (CD4+ CD25+,CD127−, CD45RO−/CD62L+, PD1+) p = 0.02, CD25+ effector memory CD8+ T cells (CD8+, CD45RO+/CD62L−, CD25+) p > 0.1, PD1+ effector memory CD8+ T cells (CD8+, CD45RO+/CD62L−, PD1+) p > 0.1, PD1+ end-stage Treg (CD4+ CD25+,CD127−, CD45RO−/CD62L−, PD1+) p = 0.1, and CD127+ effector memory CD4+ T cells (CD4+, CD45RO+/CD62L−, CD127+) p > 0.1. (B) Dotplots showing PD1 (y axis) and FSC (x axis) expression in the five T cell subsets are described in (A), in three representative patients that did not reject, and three representative patients that did reject.

