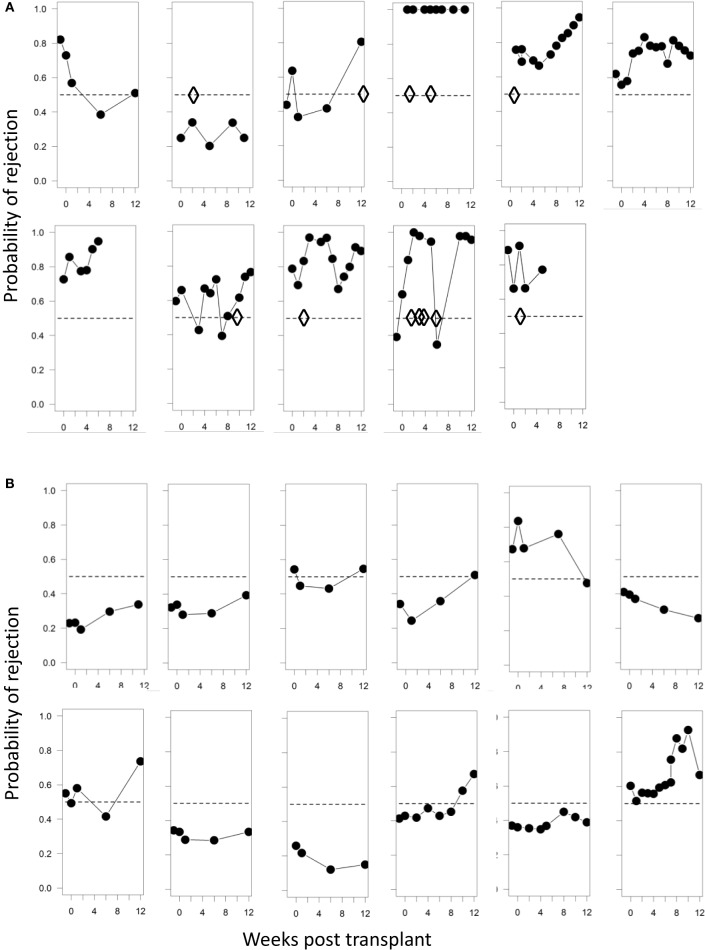
Figure 6.
Probabilities of identifying a rejection episode calculated from the SVM model. (A) Trajectories of the probability of rejection determined by SVM for each patient who clinically presented with rejection. Diamonds represent each clinically observed rejection episode. In panel 1 rejection occurred at 6 months; in panel 6 at 12 months, and in panel 7 at 24 months. (B) Trajectories of the probability of rejection determined by SVM for patient number 12–23 (Table 1), who presented with no clinical signs of rejection. The SVM is trained solely on baseline samples and evaluated using leave-one-out cross-validation.

