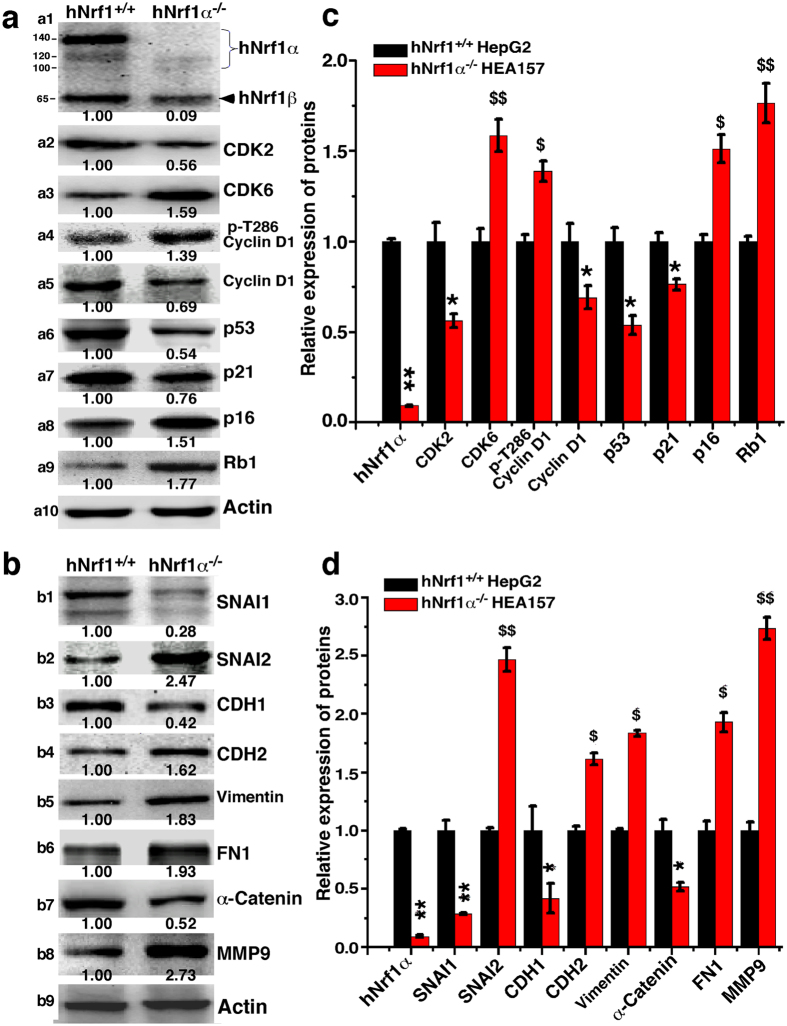
Figure 13. Alterations in translational expression of distinct genes in Nrf1α−/− cells.
Equal amounts (30 μg) of protein extracts from HepG2 (Nrf1α+/+) and HEA157 (Nrf1α−/−) cells were subjected to electropherotic separation by SDS-PAGE containing 8% or 10% polyacrylamide. Subsequently, the resolved proteins were determined by immunoblotting with distinct primary and secondary antibodies, followed by visualization by using the enhanced chemiluminescence. The intensity of immunoblotted protein bands was quantified by using the Quantity One software developed at Bio-Rad Laboratories, and normalized to the levels of β-actin as an internal control to verify the amount of proteins loaded in each well. The results were calculated as a fold change (mean ± S.D) of protein expression levels of genes controlling the cell cycle (a), metastatic and invasive behaviour including the EMT markers (b) in Nrf1α−/− cells, and are also shown graphically (c,d) herein as a representative of at least three independent experiments undertaken on separate occasions. Significant decreases (*p < 0.05, **p < 0.01, n = 9) or significant increases ($p < 0.05, $$p < 0.01, n = 9) are indicated, relative to corresponding protein levels of indicated genes expression in wild-type Nrf1α+/+ cells.

