
Figure 4.
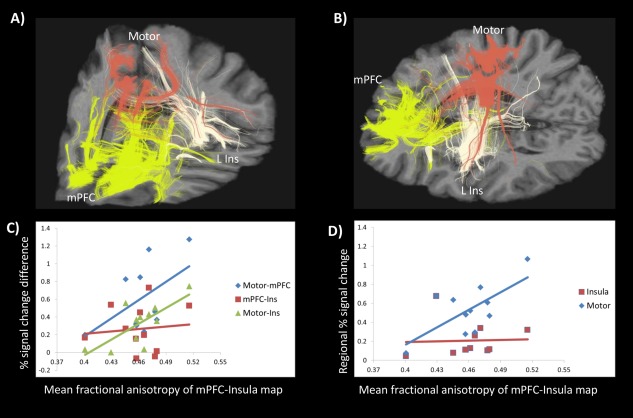
Example of the three deterministic multi‐tensor tractography models generated in an individual, as seen anteriorly (A) and sagittally (B), seeded from the mPFC (yellow), left insula (white), and motor cortex (red). The coordinates of the brain slices chosen for illustrative purposes, and which cut through the ROIs, are x = 12, y = −10, z = 4 in MNI space. mPFC‐Insula connectivity is related to aversive signalling in the motor cortex, indicated by Pearson correlations between (C) connectivity strength (i.e. mean fractional anisotropy) of the mPFC‐insula overlapping white matter map and the difference in signal changes between each region pair and (D) correlation between mPFC‐insula connectivity and motor cortex activity during the aversive stimulus. [Color figure can be viewed in the online issue, which is available at http://wileyonlinelibrary.com.]